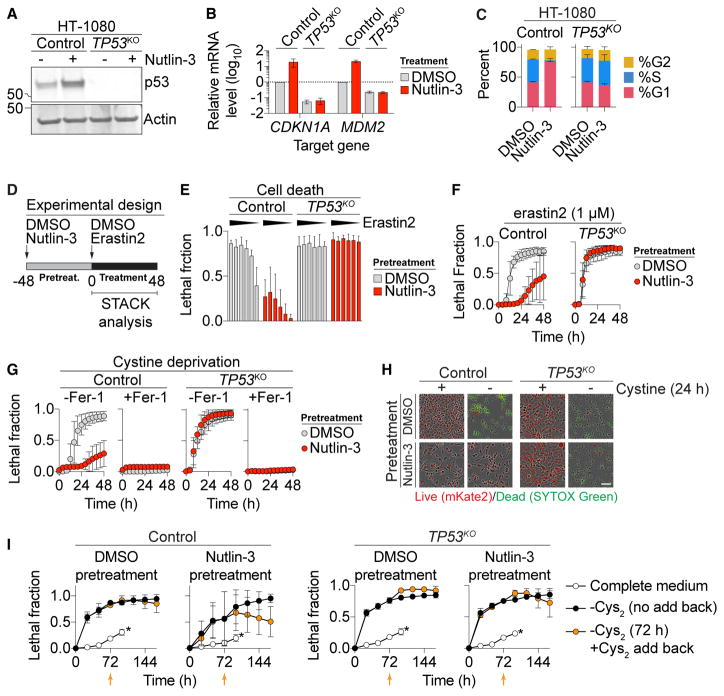
Figure 1. p53 Suppresses Ferroptosis.
(A) p53 levels determined by immunoblotting.
(B) Expression of p53 target genes ± nutlin-3 (10 μM, 48 hr).
(C) Cell-cycle profiles ± nutlin-3 (10 μM, 48 hr).
(D) Standard cell death experimental design, involving an unobserved 48-hr pretreatment phase and a 48-hr compound treatment phase, where cell death was measured using scalable time-lapse analysis of cell death kinetics (STACK).
(E) Cell death (lethal fraction) at 36 hr of erastin2 treatment. Erastin2 was tested in a 6-point, 2-fold dose-response series (indicated by black triangle), with a high concentration of 2 μM. On the y axis, 0 = all cells alive and 1 = all cells dead.
(F and G) Cell death over time in response to erastin2 (F) and cystine deprivation (G) following pretreatment with or without (10 μM, 48 hr).
(H) Representative images from (G). Scale bar, 25 μm.
(I) Cell death over time. Orange data points represent cells transiently (72 hr) deprived of cystine (Cys2) followed by Cys2 restoration. Orange arrows indicate the time point of Cys2 add back. An asterisk indicates cells maintained in cystine-containing medium; time courses were terminated at 96 hr due to high-population confluence.
Data represent mean ± SD from at least three independent biological replicates (B, C, E–G, and I).

