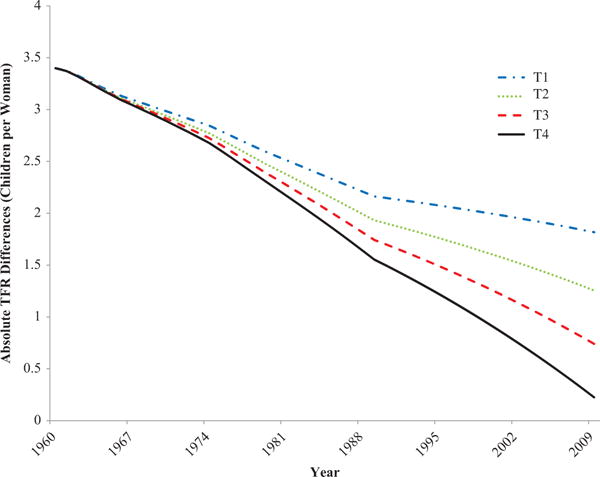
Figure 3. Simulated trajectories of absolute TFR differences, 1960–2009.

Note: T1 through T4 represent four different stylized bilateral trade trajectories, where T4 is the scenario where the most trade occurs and T1 is the scenario where zero trade occurs. T2 and T3 are intermediate scenarios.
Source: Author’s calculations based on regression 4 in table 3 and stylized data described in text.
