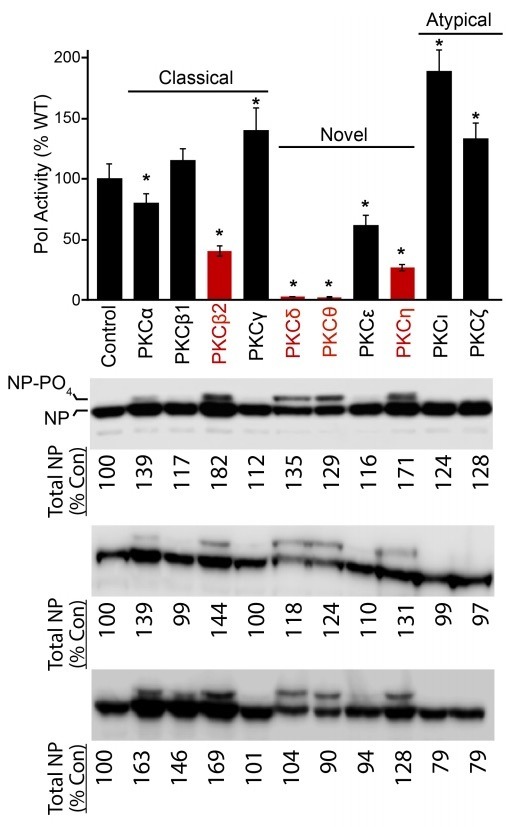
Author response image 1.
NP levels were quantified for data presented in Figure 1A.
Polymerase activity assays data from Figure 1A (n=3 +/-sd). NP levels in each replicate were detected by blotting. Total NP levels in the presence of PKC were normalized to that of the control. The top gel is that shown in Figure 1A. The middle and bottom gels are from the other replicates in the experiment.