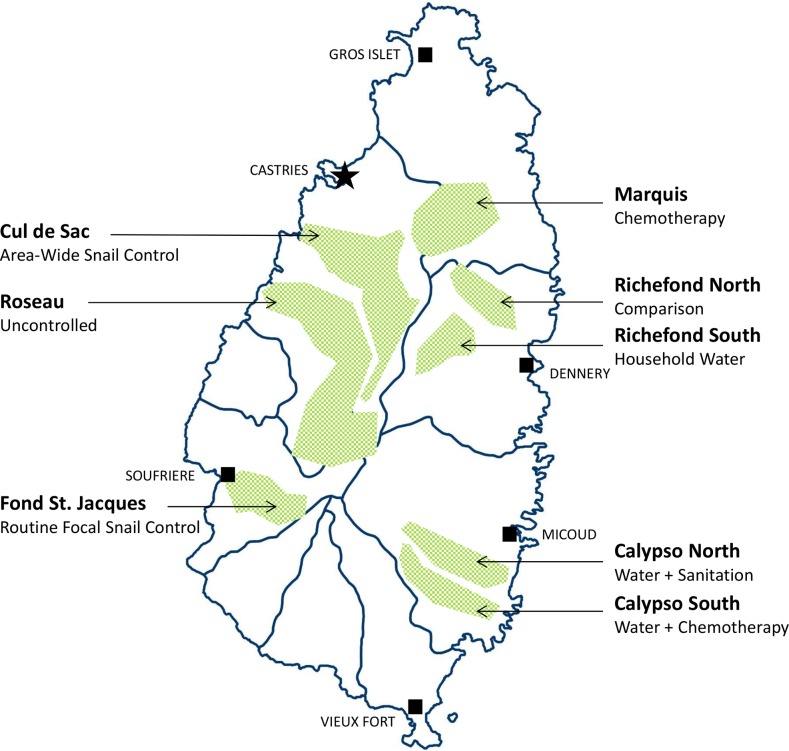
Fig 1. Sketch map of St. Lucia Island, indicating valleys selected for intervention assignments in the 1965–1981 comparison trial of S. mansoni control strategies.
Shaded areas indicate the separate valley locations where the different study interventions were tested during the course of the St. Lucia Project. Labels indicate the names of the selected valleys and which interventions were performed at each location. Map created with QGIS v.2.18.10 software (http://www.qgis.org) using a country base map provided by the GADM database of Global Administrative Areas (http://www.gadm.org).

