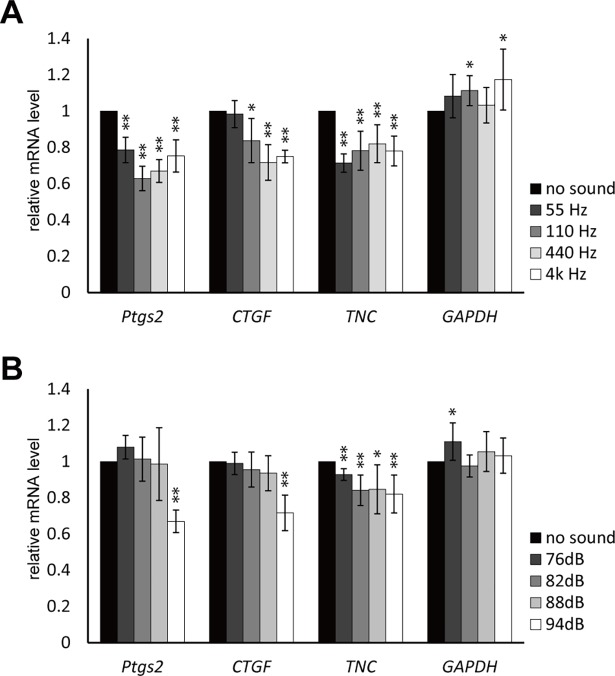
Fig 3. The effect of different frequency and sound pressure level on the target gene regulation.
(A) ST2 cells were exposed to 94.0 dB sine-wave sound with 55 Hz, 110 Hz, 440 Hz, and 4 kHz frequencies. Total RNA was extracted 0 and 2 hours after the sound exposure. (Error bars represent standard deviation, n = 3. * indicates P < 0.05 and ** indicates P < 0.01 to the 0 hour sample.) (B) ST2 cells were exposed to 440 Hz sine-wave sound at 76.0, 82.0, 88.0, and 94.0 dB SPL. Total RNA was extracted 0 and 2 hours after the sound exposure. (Error bars represent standard deviation, n = 6. * indicates P < 0.05 and ** indicates P < 0.01 to the 0 hour sample.).

