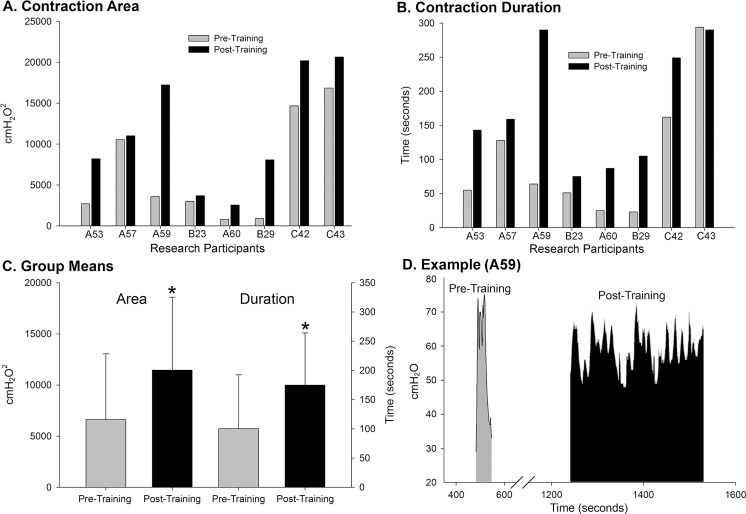
Fig 7. Bladder contraction data summary.
A comparison of pre- and post-training bladder contraction values (area under the curve and duration) for the eight research participants receiving LT. All research participants had an improvement in the detrusor contraction area (A) and 7/8 had improved duration (B). Collectively, the group values post-training (C) were significantly greater compared to pre-train values (area—p = .016; duration–p = .019). An example of the entire detrusor muscle contraction cycle is provided for participant A59 (D) to illustrate a greater capacity for bladder filling was maintained post-training and generated a larger voiding contraction for a longer duration.

