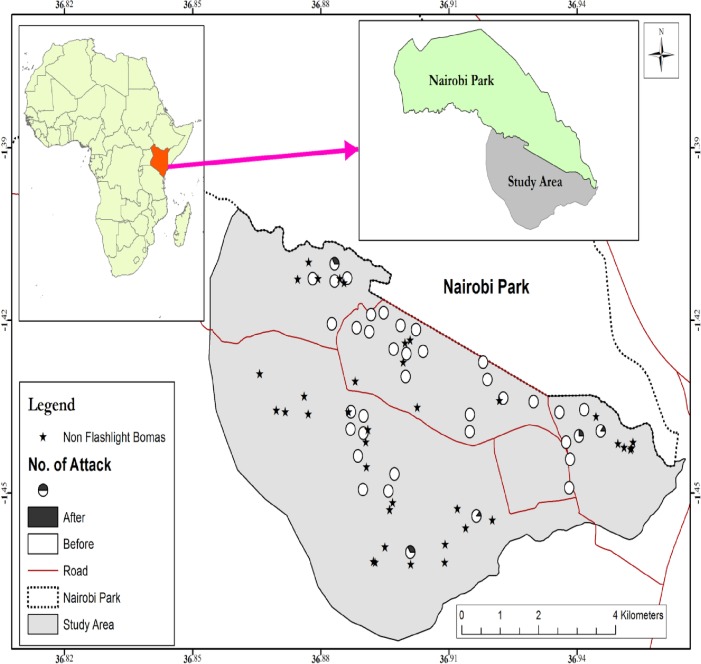
Fig 2. A map of the study area showing the proportion of boma attacks prior to and after installation of the flashlight technique.
Empty circles (○) represent bomas where attacks had been reported before installation and none after installation. The partly filled circles (◔) represent bomas where attacks took place after flashlight installation. The stars (★) represent bomas of interview participants without flashlights.

