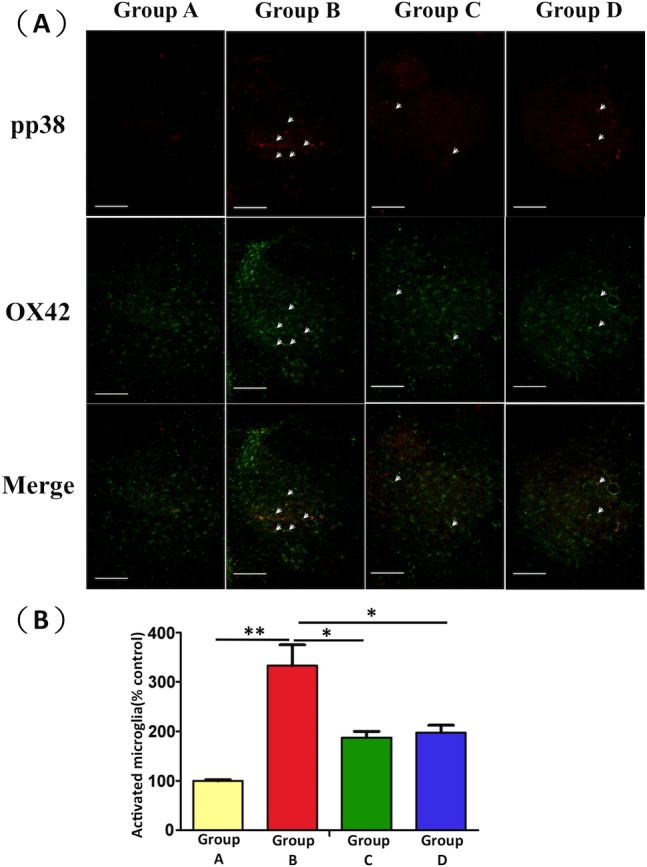
Fig 2. Immunofluorescence staining results for detecting activated microglia expression in the spinal cord ventral horn.

(A) Increased expression of activated microglia was observed in Group B compared with Group A. EPO administration resulted in lower microglia expression in Groups C and D compared with Group B (scale bars: 100 μm). (B) Quantitative analysis of activated microglia revealed a significant increase in the number of activated microglia in Group B compared with Group A. EPO treatment attenuated microglia activation. Values are expressed as a percentage of the mean ± SEM (n = 6). *: p < 0.05; **: p < 0.01.
