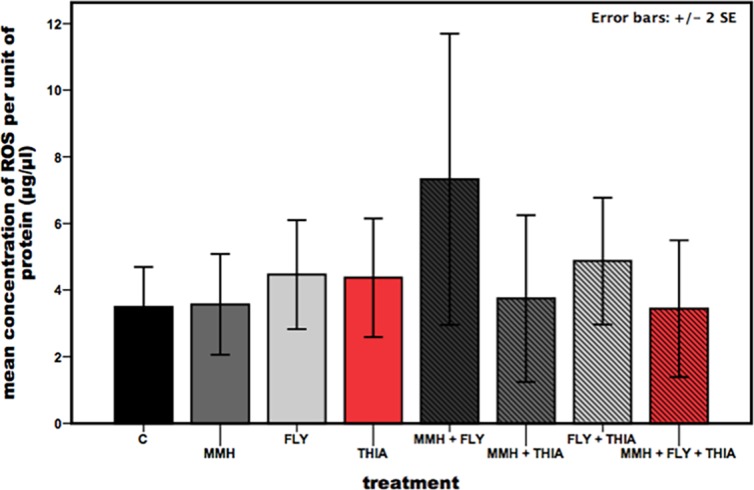
Fig 4. ROS concentration in the gut of honeybees after being exposed to different agricultural agents.

Differences in the mean concentration of reactive oxygen species in honeybee midguts, adjusted to the units of protein, when feeding on different diets. Diets were inoculated with potential agricultural stressors (C = control, MMH = E. faecalis strain MMH594, FLY = E. faecalis strain FLY1, THIA = thiacloprid). Results represent mean values ± 2 s.e.m, ANOVA, n = 16 for each treatment group. Bars are indicated in: black = control, dark-grey = MMH, light-grey = FLY, red = THIA, shaded black = MMH+FLY, shaded dark-grey = MMH+THIA, shaded light-grey = FLY+THIA, shaded red = MMH+FLY+THIA.
