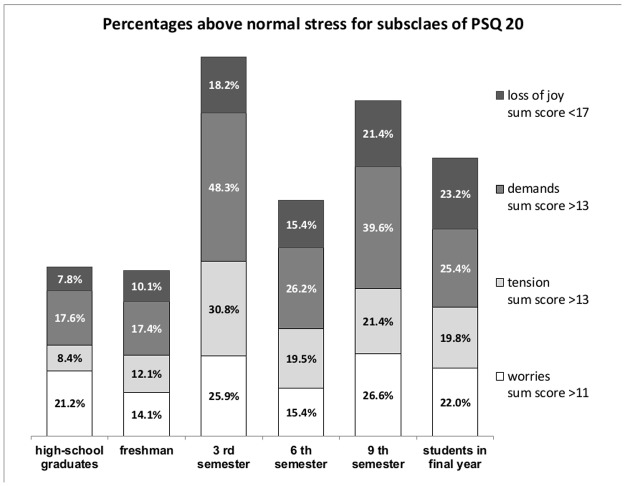
Fig 2. Illustration of the prevalence rates of all subscale values above or below reference sub scores in different stages of medical training.
The bars represent the prevalence rate of students and high school graduates in the respective sub-scales of the PSQ-20 above the respective reference values. Significant differences emerged for the sub scales “loss of joy” with (χ2 = 32.4; df = 5; p < .01**). Post hoc analyses yield that students in final year, students in 9th semester and 3rd semester students achieved the highest proportion below the reference values with prevalence rates between 18.2% and 23.2%. 6th semester students had lower rates as these groups with 15.4%, but higher prevalence rates than high-school graduates (7.8%) and freshman students with 10.1%. Significant differences also emerged for the sub scales “high demands” with (χ2 = 43.9; df = 5; p < .01**). Students in 3rd semester and 9th semester had highest proportion above the reference values with prevalence rates of 48.3% and 39.6%. Students in the 6th semester and students in final year had lower rates as these groups with 26.2% and 25.4%. High-school graduates and freshman students achieved rates of 17.6% and 17.4% for “highly demands”. For the sub scale “high tension”, it was also emerged significant differences with (χ2 = 67.8; df = 5; p < .01**). Students in 3rd semester achieved the highest proportion above the reference values with a prevalence rate of 30.8%. Students in the 9th semester, students in final year and students in 6th semester had significantly lower rates as 3rd semester with prevalence rates between 19.4% and 21.4%. On this sub scale high-school graduates and freshman students also achieved lowest prevalence rates above reference value with 8.4% and 12.1%. There was no significant difference for the subscale “high worries” with (χ2 = 11.4; df = 5; p > .05).

