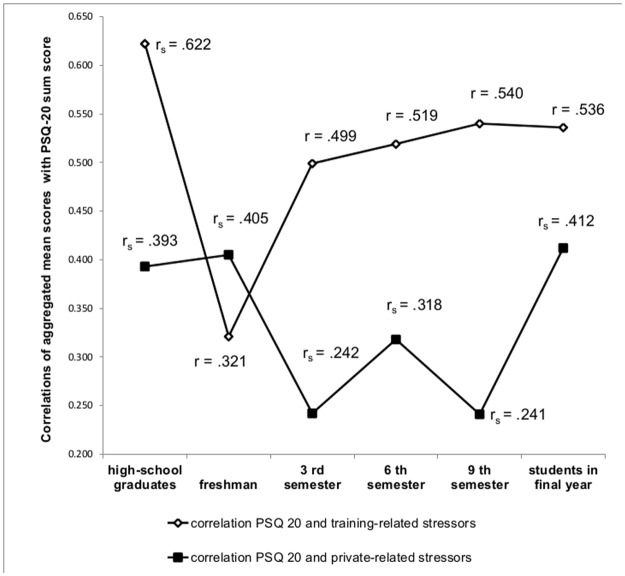
Fig 3. Illustration of the correlations of aggregated mean scores for training-related stressors and private-related stressors with the PSQ-20 total sum score.
The two lines symbolize the respective association of the aggregated sum scores for private and training-related stressors with the PSQ-20 sum score. For the aggregation, the single items were summed and a total score was formed. The two lines do not symbolize a progression, but the cross-sectional data points within the investigated subgroups. The correlations were calculated using Spearman rho (rs) or Pearson (r) procedures.

