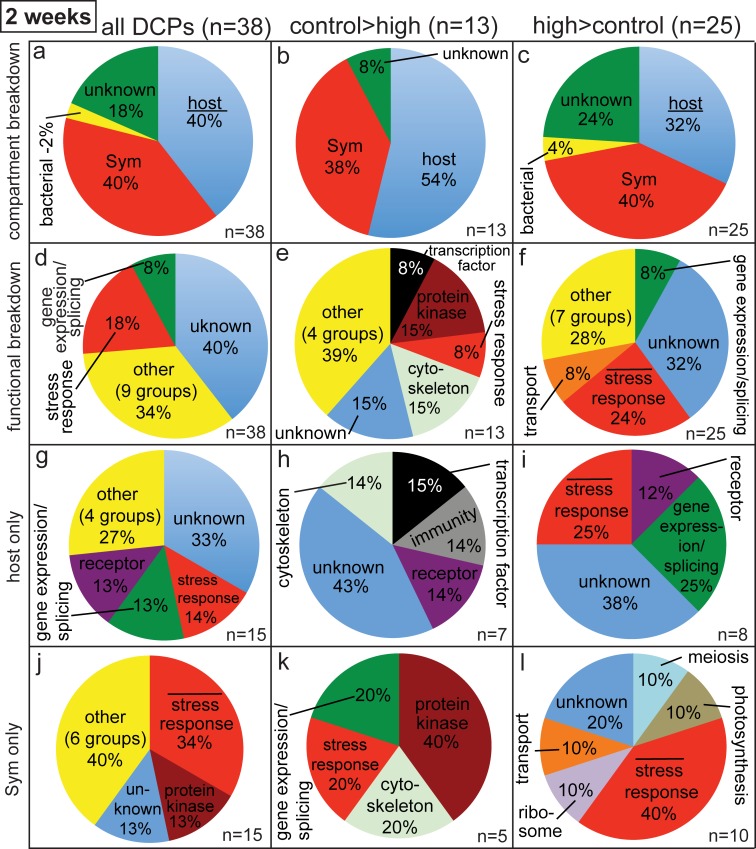
Fig 2. Pie graphs showing breakdown of differentially concentrated proteins (DCPs) between control (C2) and high (H2) temperature samples of the two-week sampling time.
Three and six protein spots were found to be more highly concentrated in the C2 (i.e., C>H) and H2 (H>C) proteomes, respectively, and 13 C>H and 25 H>C DCPs were identified from these nine spots. When the ratio of host/Symbiodinium (Sym) DCPs in panels a and c was significantly lower (z-test, p<0.05) than the Pocillopora acuta/Sym mRNA ratio of 1.9 (i.e., a 65/35% host coral/Sym ratio), the word “host” has been underlined. When the cellular process “stress response” was over-represented in the proteomes of the host coral (g-i) and Sym (j-l) relative to the host coral (6% of the P. acuta host transcriptome) and Sym (4% of the Sym transcriptome) transcriptomes [29], respectively (2-sample proportion test, p<0.05), a bar has been inserted over the term “stress response”.

