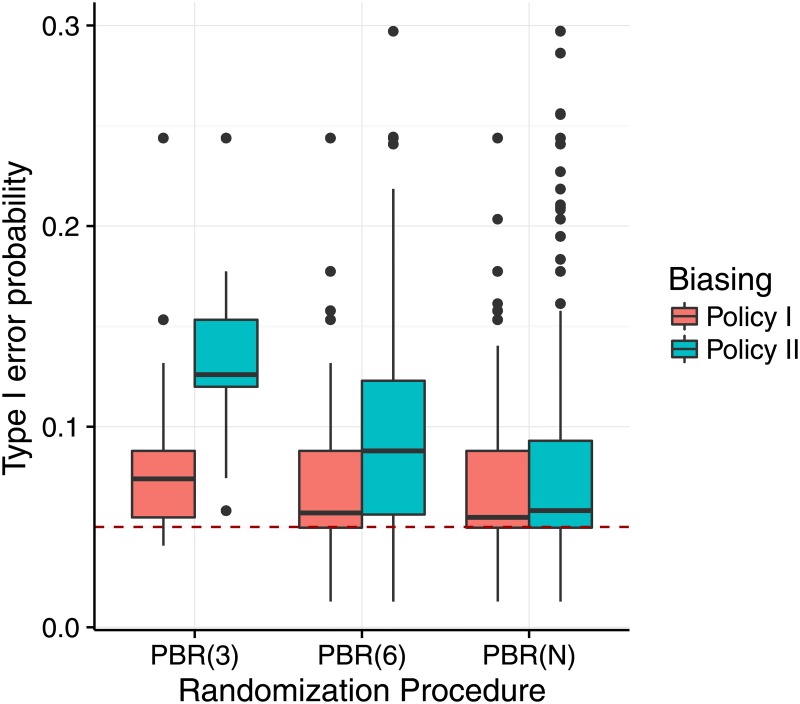
Fig 1. Distribution of the type I error probability under selection bias for different biasing policies.
Each scenario is based on a sample of r = 10,000 sequences, sample size N = 12 and number of treatment groups K = 3, assuming the selection effect η = f4,3 = 1.07 for permuted block design (PBD). The red dashed line marks the 5% significance level.

