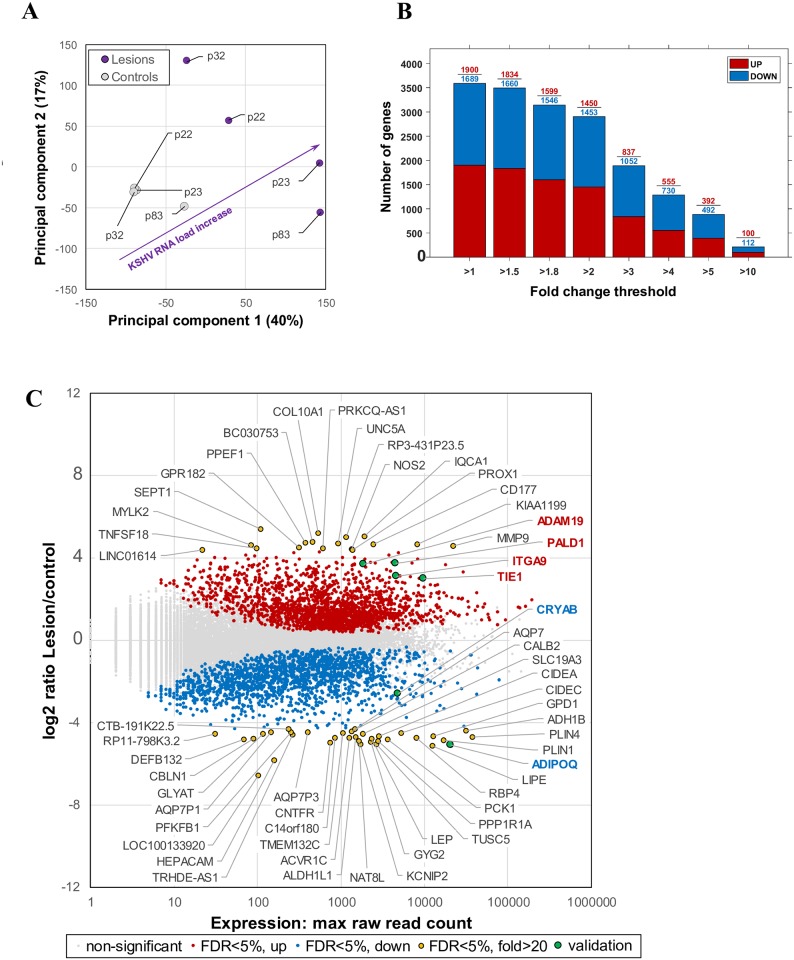
Fig 3. Cellular gene expression.
(A) Relationship between the samples based on cellular gene expression using the Principal Component (PC) analysis. Combination of the first and the second PC coincided with the KSHV RNA load, indicating that KSHV genes expression affected the cellular gene expression. (B) Number of cellular genes significantly (FDR<5%) differentially upregulated (red) or downregulated (blue) in the lesion vs control samples, expressed in fold changes. (C) Significantly differentially expressed cellular genes and their raw expression (maximum raw read count across samples). All cellular genes with ≥20 fold change are highlighted with yellow dots and genes selected for real time-PCR validation are highlighted with green dots.

