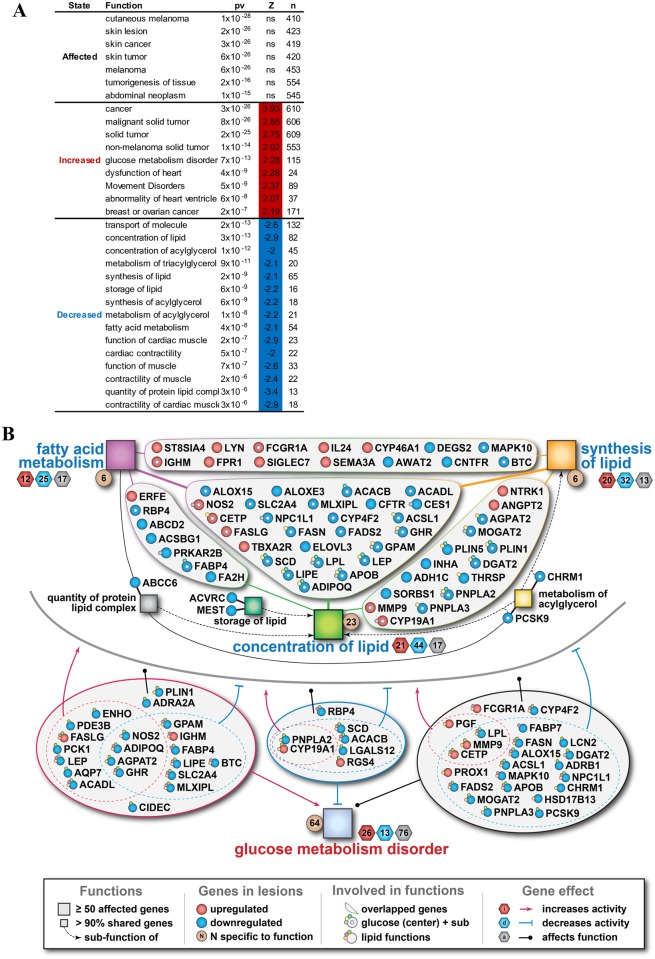
Fig 7. Predicted disease and biological functions associated with cellular gene expression.
(A) Enrichment analysis for functions significantly affected in the lesions based on ≥5 fold of gene expression changes. Top functions with significantly predicted activation state (p<10−5, |Z|>2) are shown. “pv” = p-value, “n” = number of known target genes changed in lesions, “Z” = z-score for the predicted change of activity, “ns” = unassigned. (B) Significantly changed genes involved in overlapping lipid-related functions and/or glucose metabolism disorder in lesions are shown. Small squares indicate significantly enriched sub-functions that share >90% of genes with major functions (big squares). Top portion of the figure (above the grey line) represent overlap between various lipid functions, while the bottom portion (below the grey line) illustrates cross-talk with glucose metabolism disorder. The hexagons beside major functions indicate the number of genes contributing to that function’s activation (red), inhibition (blue) or unspecified effect (gray). The brown circles beside major functions indicate the number of genes which belong exclusively to that major function. Circles indicate genes shared between at least 2 functions that are up-regulated (red) or down-regulated (blue). Gene involvements are shown by solid and dotted lines (red for increased activity, blue for decreased activity, black for unspecific activity) and by small circles attached to a given gene with color matched to the color of square representing the corresponding function. Illustrative example: Concentration of lipid (green big square) in the center of the figure is repressed in lesion (blue font), as evidenced by 44 genes suppressing that function in lesions (blue hexagon), while only 21 genes activate the function (red hexagon) and 17 genes affect it in an unspecified direction (gray hexagon). Out of these 82 genes, there are 23 unique genes (brown circle) specific to this function and the rest are shared with at least one other function. Green line link with the upper left group of genes that are shared with fatty acid metabolism. Green line link with the upper right group of genes that are shared with synthesis of lipid. Green line in the middle link to the group of genes that are shared between the three major lipid functions (Fatty acid metabolism, concentration of lipid and synthesis of lipid). ADIPOQ (locates at the bottom of the middle group of genes) is a gene shared between these three major lipid functions. It is also involved in the metabolism of acylglycerol (attached small yellow circle), storage of lipid (attached small dark green circle) and glucose metabolism disorder (center small cyan circle). Given its involvement in glucose metabolism disorder, ADIPOQ is also shown in the bottom portion of the figure where the attached small circles illustrate its involvement in the three major lipid functions. Its location in the red group of genes at the lower left is indicative of genes whose changes result in activation of the function (red arrow). Given that ADIPOQ is represented by a blue circle (down-regulated genes in lesions), it means that the downregulation of ADIPOQ in lesion results in activation of glucose metabolism disorder. Finally, ADIPOQ is among the genes that suppress one lipid function (blue dotted line with ┬) and activate another (red dotted line with arrow).

