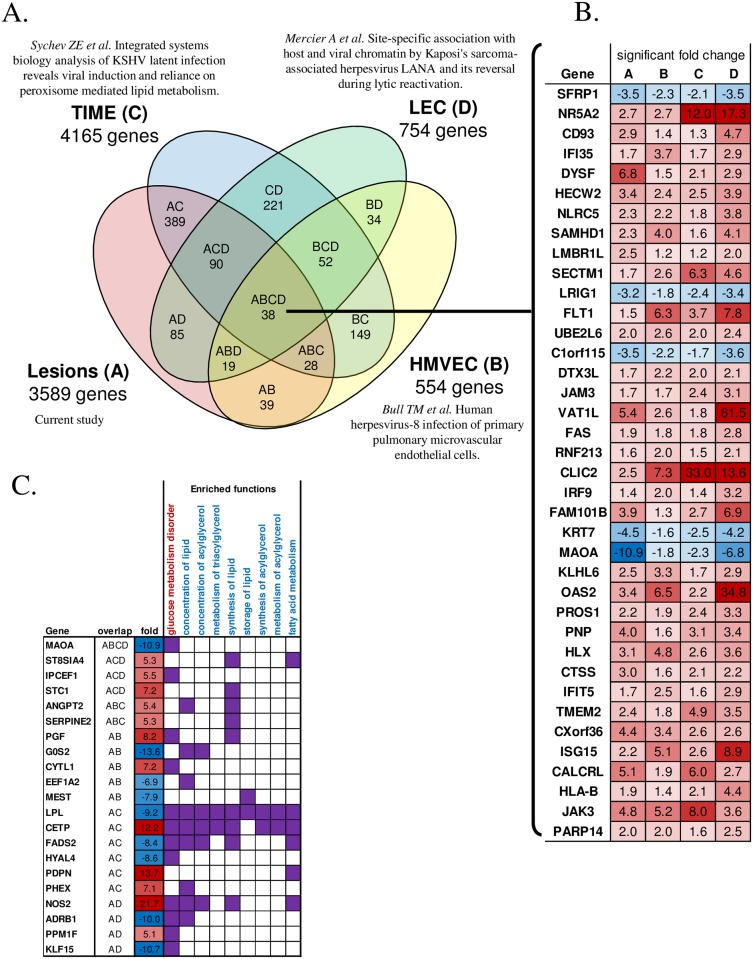
Fig 9. Gene overlap with other studies.
(A) Venn diagram showing the number of overlapped genes that were significantly differentially expressed between the KS lesion and 3 other in vitro studies. Only genes with expression changes at FDR<5% in the same direction (lesion vs control or infected vs non-infected cells) were considered an overlap. (B) List of the 38 overlapped genes among the 4 studies. Lesion/control and infected/non-infected fold changes are shown. Red indicate up-regulation. Blue indicate down-regulation. (C) Genes overlapped with at least one study and are also involved in significantly enriched lipid and glucose functions.

