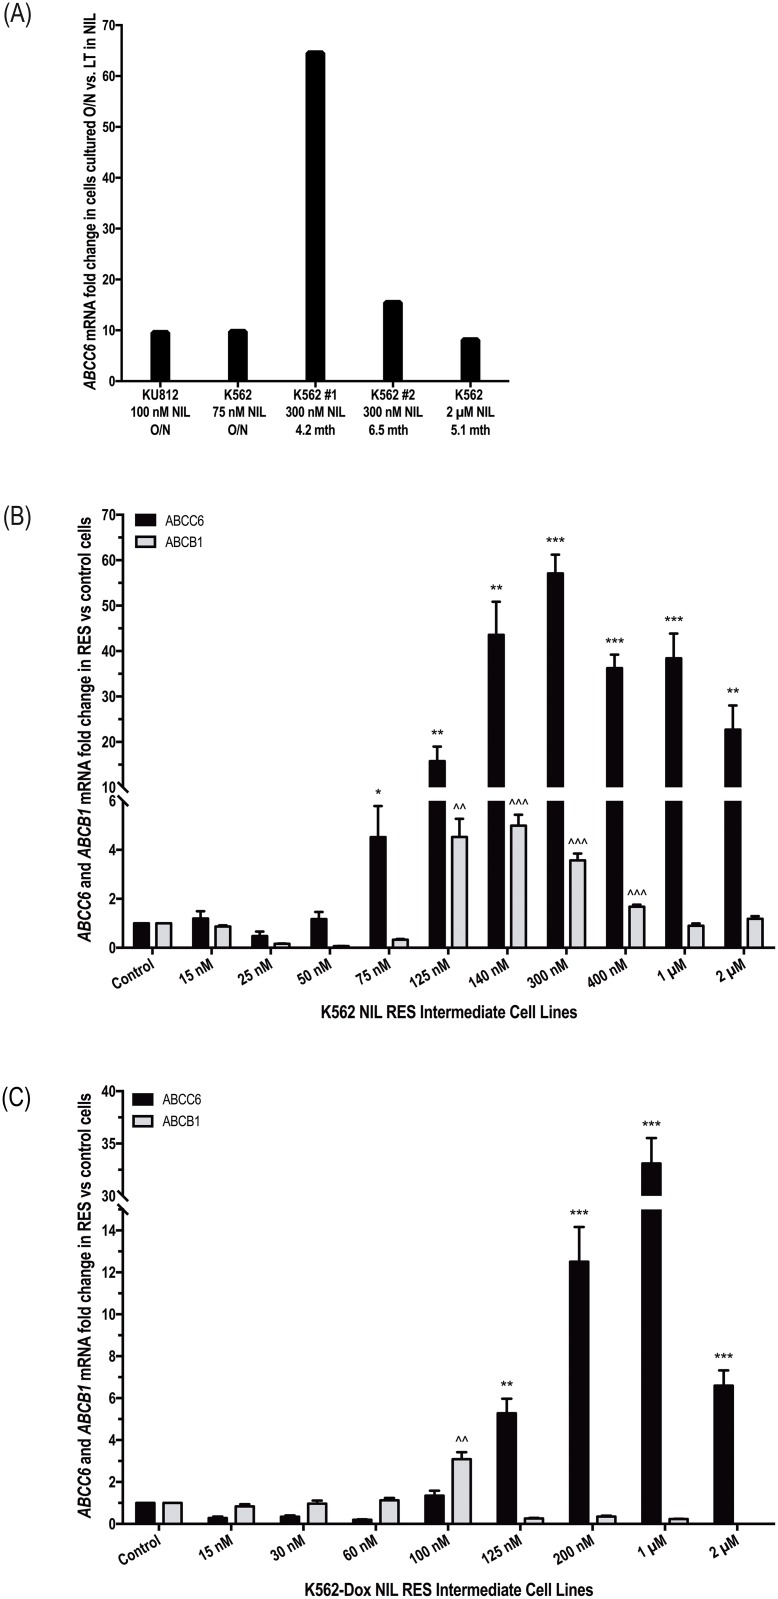
Fig 2. ABCB1 and ABCC6 mRNA levels increase in concert during development of nilotinib resistance in BCR-ABL1+ cell lines.
(A) Expression levels of ABCC6 mRNA were assessed by Taqman® transporter array in K562 and KU812 cells exposed transiently (overnight, O/N) and long term to nilotinib Expression levels of ABCC6 and ABCB1 mRNA were assessed in (B) K562 and (C) K562-Dox cells gradually made resistant to nilotinib by exposure to increasing concentrations over time. (A) ABCC6 levels were normalized to selected control genes (as determined by Thermo Fisher Scientific DataAssist Software v1.0) and fold change in cells cultured in the presence of nilotinib calculated relative to cells cultured in the absence of nilotinib. (B-C) ABCC6 and ABCB1 levels were normalized to the housekeeping gene BCR and fold change in resistance intermediates calculated relative to control cells (control cell fold change was set at 1). The mRNA expression represents the mean of six independent experiments performed in triplicate. Statistical analyses were performed using Student’s t-test. Statistically significant p-values are denoted by asterisks (ABCC6) and carets (ABCB1) * p<0.05; ** p<0.01; *** p<0.001). Error bars represent SEM. NIL = nilotinib; RES = resistant.

