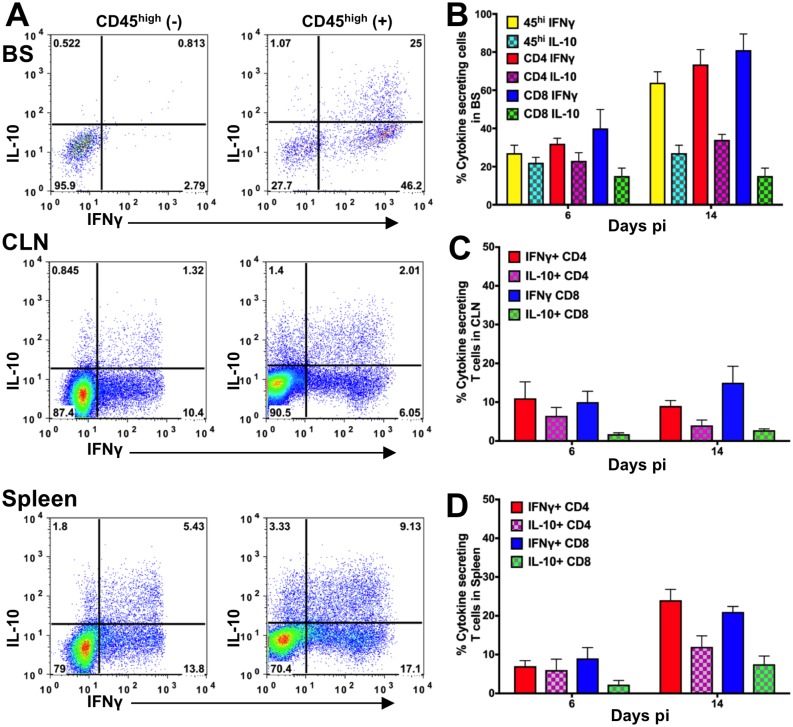
Fig 1. IFNγ and IL-10 dominate the cytokine profile of T cells isolated from HSV-infected WT mice.
(A) Mononuclear cells isolated from brain stem (BS, top), cervical lymph nodes (CLN, middle) or spleen (bottom) on day 6 or 14 pi from HSV-infected WT mice were probed for IL-10 and IFNγ by intracellular cytokine staining (ICS). Representative FACS plots show cells isolated at day 14 pi. All flow cytometry plots show antigen-stimulated cells (+) except for top left panel “for BS (-)”. Bar plots depict % IL-10- or IFNγ-secreting CD45high, CD4 or CD8 T cells in the (B) BS, (C) CLN or (D) spleen at day 6 and 14 pi. Data representative of 2 (day 14 pi) -3 (day 6 pi) experiments are shown as mean +/- SD (n = 3–4 mice / time point).

