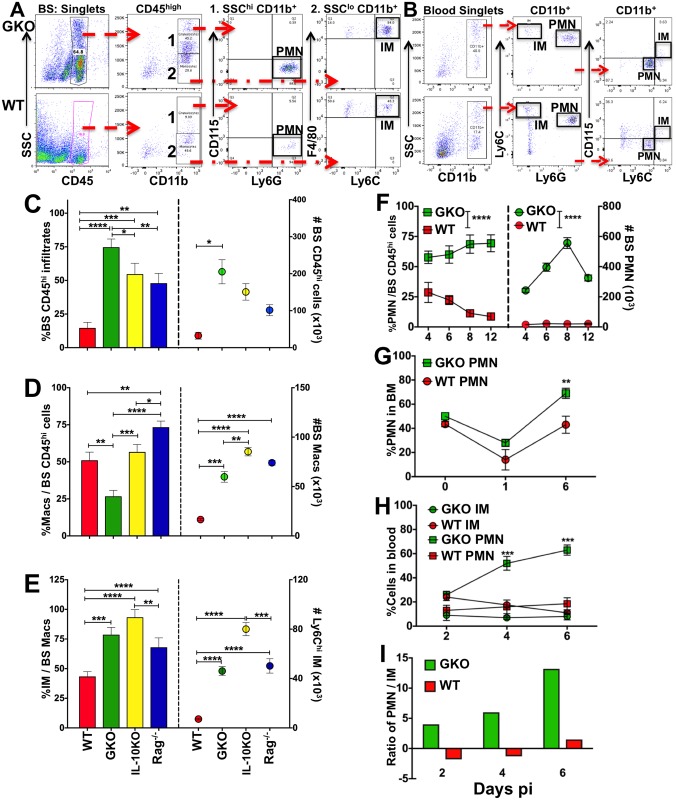
Fig 3. Neutrophil output from BM and CNS invasion is augmented in the absence of IFNγ.
Representative flow cytometry plots depicting the gating strategy used to distinguish neutrophils (PMN) and inflammatory monocytes (IM) in the (A) BS and (B) blood of HSV-infected GKO (top row) and WT (bottom row) mice: (A) BS mononuclear cells isolated at day 4 pi show CD45high infiltrating leukocytes, CD45high SSChigh CD11b+ CD115- Ly6Ghigh neutrophils (1. PMN) and F480+ CD115+ Ly6Chigh monocytes (2. IMs); and (B) blood mononuclear cells at day 6 pi show SSChigh CD11b+ CD115- Ly6G+ Ly6Cint PMN and CD115+ Ly6G- Ly6Chigh IMs. Bar plots depicting (C) % (left y-axis) and # (right y-axis) of CD45high infiltrating cells in the BS of WT, IL-10KO, GKO and Rag-/- mice at day 6 pi, (D) % (left y-axis) and # (right y-axis) of CD115+ F480+/lo monocytes / macrophages within the BS CD45high infiltrates, (E) % (left y-axis) and # (right y-axis) of Ly6Chigh IMs within the BS CD45high F480+ monocytes / macrophages. Line plots showing (F) % (left y-axis) and # (right y-axis) of Ly6G+ PMN within BS CD45high infiltrates in GKO and WT mice at the indicated time points, (G) % CD11b+ Ly6G+ neutrophils within BM (1 leg = femur + tibia) at the indicated time points, (H) % CD11b+ Ly6G+ PMN or Ly6Chigh IMs in the blood of GKO and WT mice, and (I) the ratio of PMN to IM in the blood of GKO and WT mice at the indicated time points. Data representative of 2–3 experiments are shown as mean +/- SD; *p<0.05, **p<0.01, ***p<0.001, ****p<0.0001.

