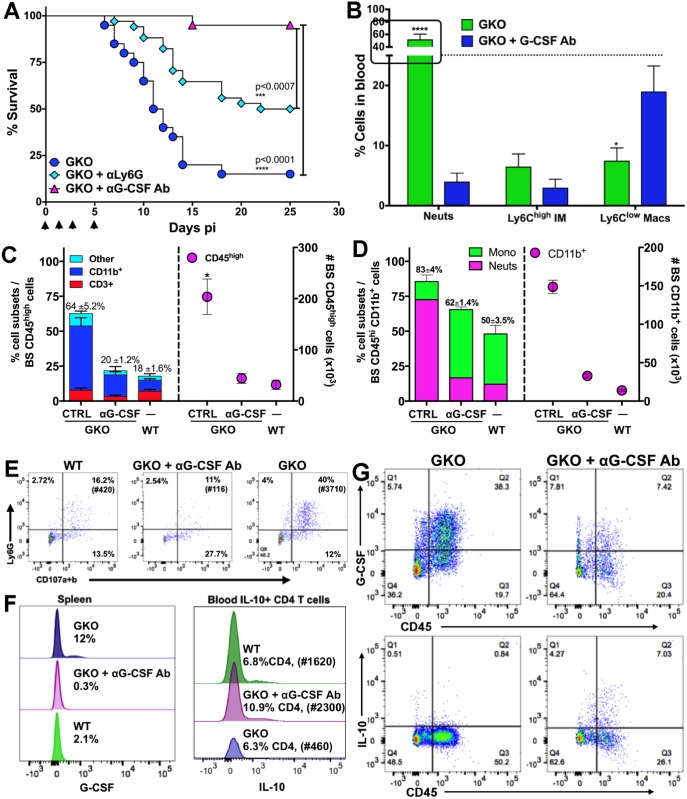
Fig 7. Depletion of G-CSF protects GKO mice by terminating neutrophil responses.
(A) GKO mice were depleted of G-CSF or neutrophils with 3 doses of αG-CSF or αLy6G Ab (250 μg) respectively on days 0, 1 and 4 pi, and observed for survival following HSV infection. ***p<0.0007; ****p<0.0001. Data representative of 2 (for G-CSF)—3 (for Ly6G) experiments (n = 10–20 mice). (B) % Cell subsets isolated from blood mononuclear cells of GKO or αG-CSF-treated GKO mice at day 6 pi, ****p<0.0001, *p<0.05. (C) % (left y-axis) and # (right y-axis) of CD45high cells in the BS of WT, GKO or αG-CSF Ab-treated GKO mice at day 6 pi. Numbers on top of bars indicate % CD45high cells in BS and stacked bars within the CD45high bar depict the proportions of CD3+ and CD11b+ or other cells. (D) % (left y-axis) and # (right y-axis) of CD11b+ cells within BS CD45high infiltrates in WT, GKO and α G-CSF Ab-treated GKO mice. Numbers on top indicate % CD11b+ cells and stacked bars within the CD11b bar depict the proportions of SSClow CD115+ monocytes / macrophages or SSChigh Ly6G+ neutrophils. (E) Percent degranulating (CD107a+b) Ly6G+ neutrophils within CD45high cells isolated from the BS of WT, GKO and αG-CSF Ab-treated GKO mice at day 6 pi, # in parathesis indicate total number of degranulating PMN in the BS. (F) Intracellular staining for G-CSF by splenocytes (left plot) and IL-10 by CD4 T cells in the blood (right plot) of WT, GKO and αG-CSF Ab-treated GKO mice at day 6 pi. # in parenthesis indicate total number of IL-10 secreting CD4 T cells. (G) Intracellular G-CSF (top) and IL-10 (bottom) secretion by BS cells isolated from GKO (left) and αG-CSF Ab-treated GKO mice (right) at day 6 pi.

