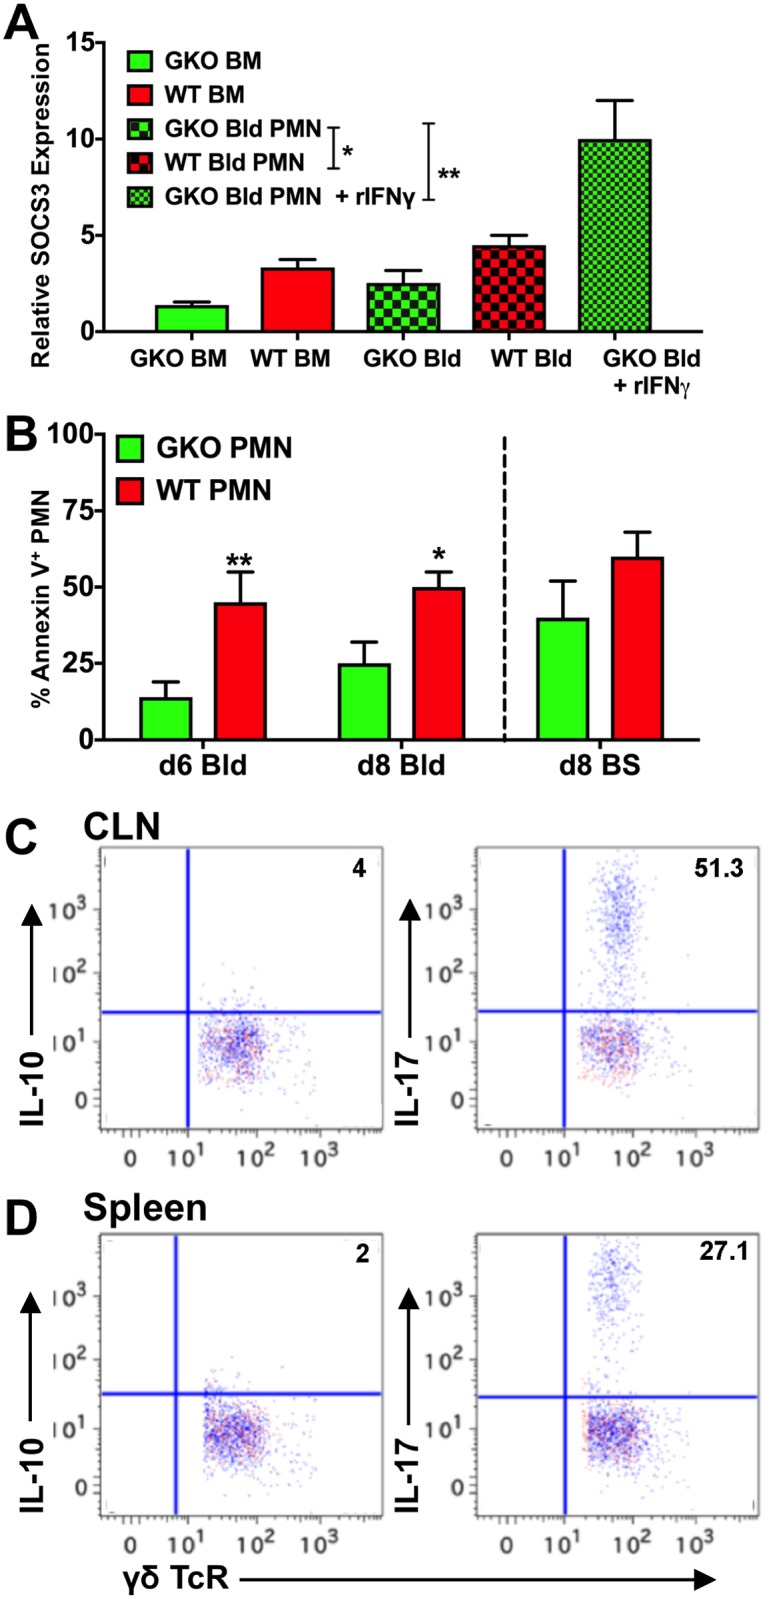
Fig 8. IFNγ controls neutrophil responses via apoptosis and SOCS3 expression.

(A) Relative SOCS3 expression from Ly6G+ neutrophils (PMN) isolated from BM and blood (Bld) of WT and GKO mice at day 6 pi, as measured by RT-PCR; levels are relative to PMN isolated from uninfected mice. Blood-derived PMN treated with recombinant IFNγ in vitro for 30 min were compared to untreated neutrophils for SOCS3 expression. Data are representative of 2–3 experiments; *p = 0.013; **p = 0.0035. (B) Bar plots depict Annexin V+ PMN in the blood of WT and GKO mice at days 6 and 8 pi and BS at day 8 pi. Data are representative of 2 experiments with 2–3 mice per group. **p = 0.0011. (C & D) FACS plots show intracellular staining for IL-10 (left plots) and IL-17 (right plots) by γδ T cells isolated from (C) CLN and (D) spleen of GKO mice at day 14 pi. Red dots indicate no antigenic stimulation; blue dots indicate cells stimulated with PMA + ionomycin + HK-HSV.
