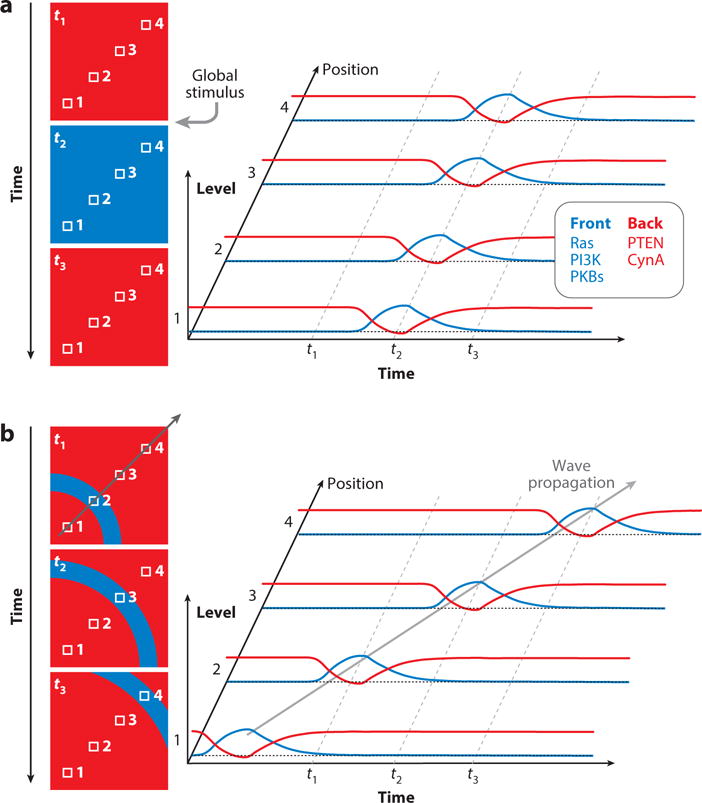
Figure 4.

Correlation between spatial and temporal activities of front (green) and back (red) proteins. A. The colored boxes on the left represent sequential time instants. The small numbered white squares in each box denote spatial references. The plots on the right show how the global stimulus manifests as a time course at each spatial position and how the front and back proteins or biosensors (representative activities shown in the adjoining box) associate and dissociate, respectively. B. Same format as A, but showing the position of a propagating wave at three sequential times. This causes the temporal protein activities at each position to occur sequentially, in contrast to the synchronized events triggered by the global stimulus (A).
