
Figure 3.
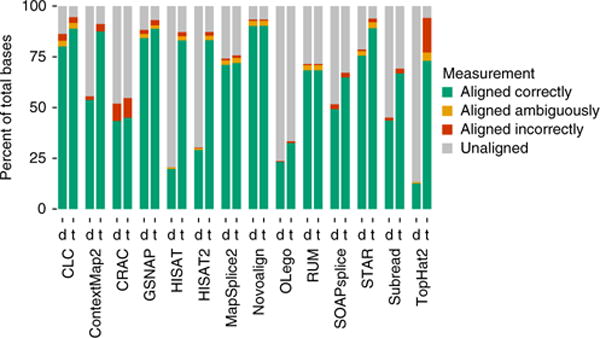
The effect of tuning parameters on the human-T3-data base-level statistics. For each tool, the figure shows the alignment statistics for the ‘default’ (d) and the ‘tuned’ (t) alignments.
Official websites use .gov
A
.gov website belongs to an official
government organization in the United States.
Secure .gov websites use HTTPS
A lock (
) or https:// means you've safely
connected to the .gov website. Share sensitive
information only on official, secure websites.
The effect of tuning parameters on the human-T3-data base-level statistics. For each tool, the figure shows the alignment statistics for the ‘default’ (d) and the ‘tuned’ (t) alignments.