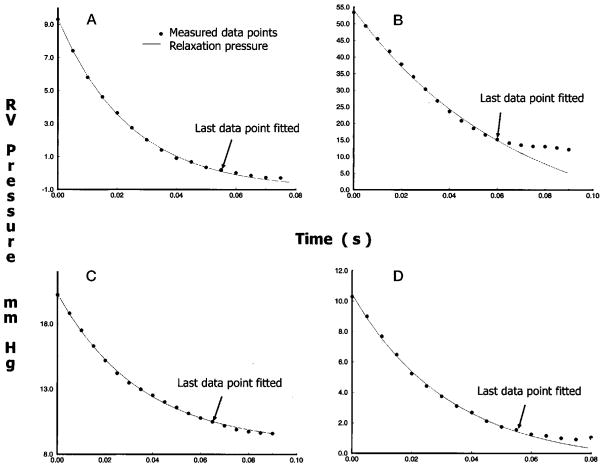
Figure 3.
Tracings of RV isovolumic pressure decay under control conditions (A), pressure overload (B), volume overload (C), and ischemia (D). Dots denote every other point in the digital ensemble average of the measured waveforms. The line shows the exponential fit. Arrows indicate the last points used in regression.

