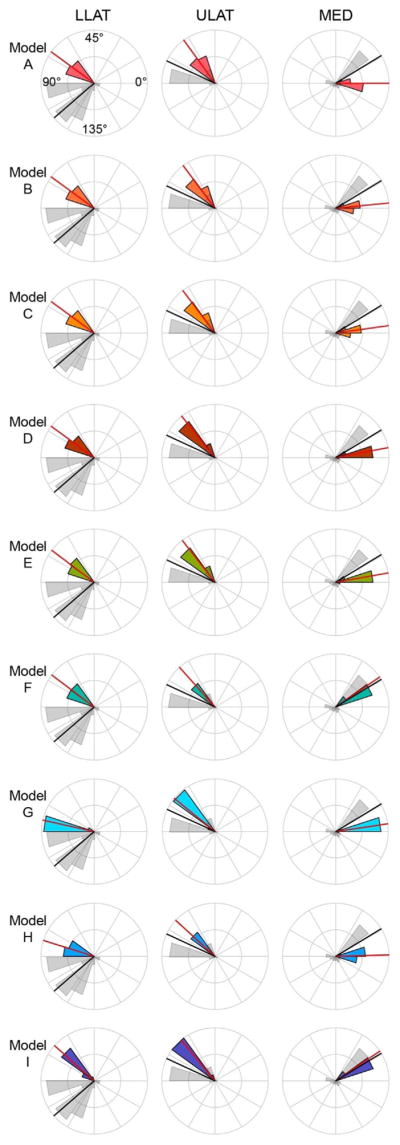
Fig. 8.

Polar histogram of the distribution of ε1 orientations (in degrees) at the LLAT, ULAT, and MED gauge sites of the FEMs compared to the in vivo experiment. Grey histogram illustrates the orientation distribution of the in vivo data, and the colored histogram illustrates the orientation distribution of the specific FEM (models are color-coded as in Fig. 7). Red and black solid lines indicate the mean orientation of the in vivo and the FEM data, respectively. Orientations are relative to the reference axes of the gauges (illustrated by dashed lines in Fig. 9).
