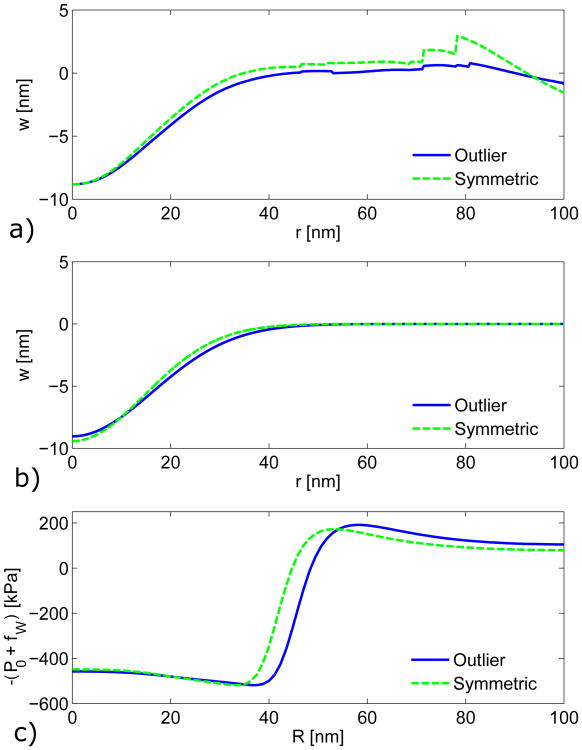
Fig. A1.
Comparisons of a) the mean profiles, b) Gaussian fits of the mean profiles, and c) the resulting wall reaction forces using the displacement sets defined in Table A1. The curves found using the “Outlier Rejection” displacement sets are represented by solid lines, and those found using the “Symmetric Selection” displacement sets are represented by dashed lines.

