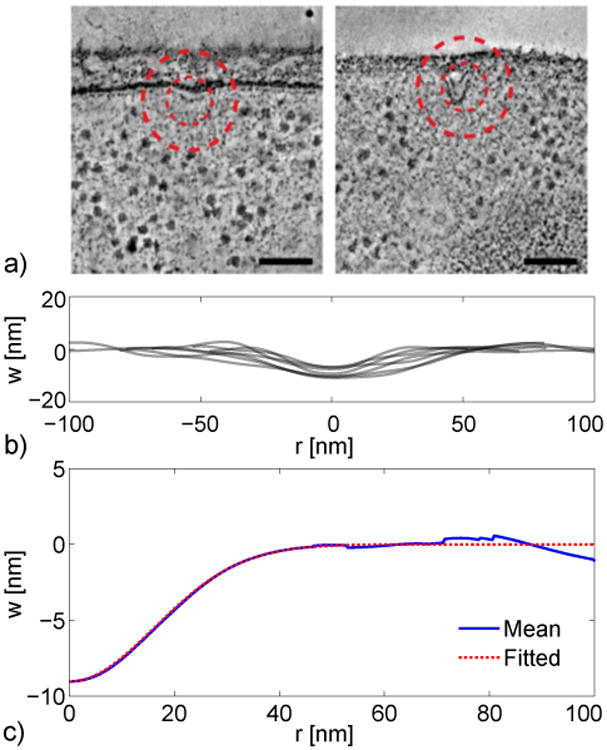
Fig. 2.

a) Electron microscopy (EM) images of endocytic profiles. The left profile shows the initial stage of endocytosis, in which the membrane forms a shallow dimple. Scale bars indicate 100 nm. Reprinted with permission from Kukulski et al. [8]. b) Selected membrane profiles from the EM experiments [8]. Vertical displacement of membrane is w. c) Mean membrane profile of the initial stage of endocytosis (solid line) and Gaussian fit (dashed line).
