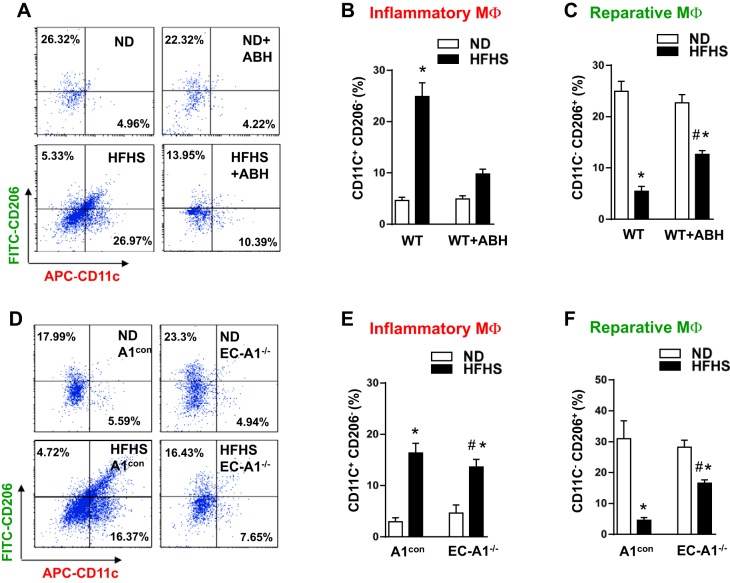
Fig. 5.
Arginase inhibition or EC-A1 deletion blunts the HFHS-induced increases in proinflammatory macrophages and limits the HFHS-induced decreases in reparative macrophages in visceral adipose tissue. Representative FACS profile showing effects of ABH (A) or EC-A1 deletion (D) on the percentage of proinflammatory (M1-like) macrophages (CD11Chigh, CD206low, and F4/80high) and reparative (M2-like) macrophages (CD11Clow, CD206high, and F4/80high) to total macrophages (F4/80high) in SVF. Flow plots correspond to the F4/80 gate. Histograms show effects of ABH (B and C) or EC-A1 deletion (E and F) on the proportions of proinflammatory and reparative macrophages to total macrophages. Values are means ± SE; n = 5–7 mice. *P < 0.05 vs. WT ND or A1con ND groups. #P < 0.05 vs. WT HFHS or A1con HFHS groups.

