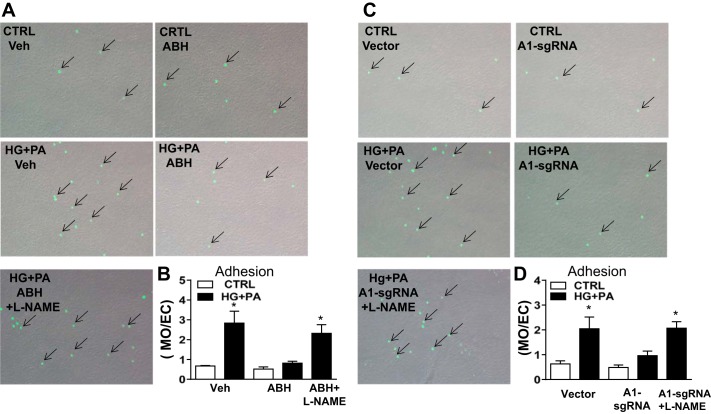
Fig. 8.
Effects of arginase inhibition or A1 knockdown on monocyte attachment to HG + PA incubated cells. Representative images showing monocyte (calcein AM stain, arrows) attachment to the HG + PA treated endothelial cells vs. cells maintained in normal media (CTRL) or treated with arginase inhibitor, nitric oxide synthase inhibitor (l-NAME), or CRISPR/Cas 9-transduction of sgRNA to knockdown A1 (A and C). Histograms show the relative numbers of calcein AM stained monocytes attached/endothelial cell among the groups (B and D). Values are means ± SE; n = 4–5 experiments. *P < 0.05 vs. CTRL cells.

