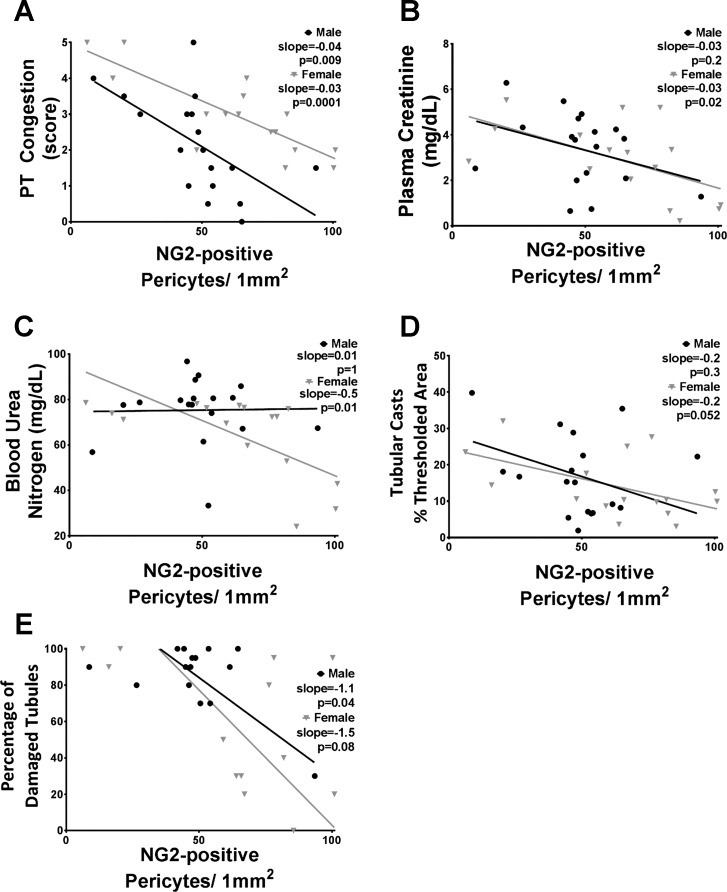
Fig. 2.
Correlation of renal injury markers and pericyte density determined by NG2 immunofluorescence. Data from each individual animal that underwent IR surgery are shown; males are represented by black circles and females by gray triangles. The markers that were compared with pericyte density include peritubular capillary (PT) congestion (A), plasma creatinine (B), blood urea nitrogen (C), percent area with tubular casts (D), and percentage of damaged tubules (E). Regression slopes and P values are shown; n = 13–18.

