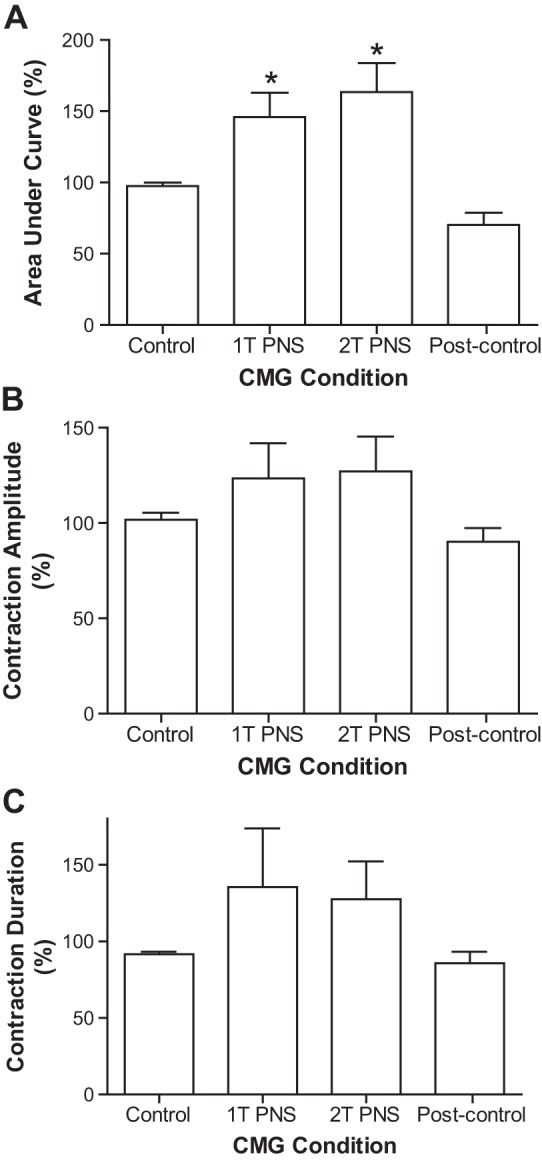
Fig. 4.

Effects of PNS on bladder contraction. A: area under the curve of the bladder contraction. B: contraction amplitude. C: contraction duration. Bladder contraction response was normalized to the control response. *Significantly (P < 0.05) different from the control response (1-way ANOVA, n = 6 cats). PNS (1–3 Hz, 0.2 ms, T = 1.4–20 V).
