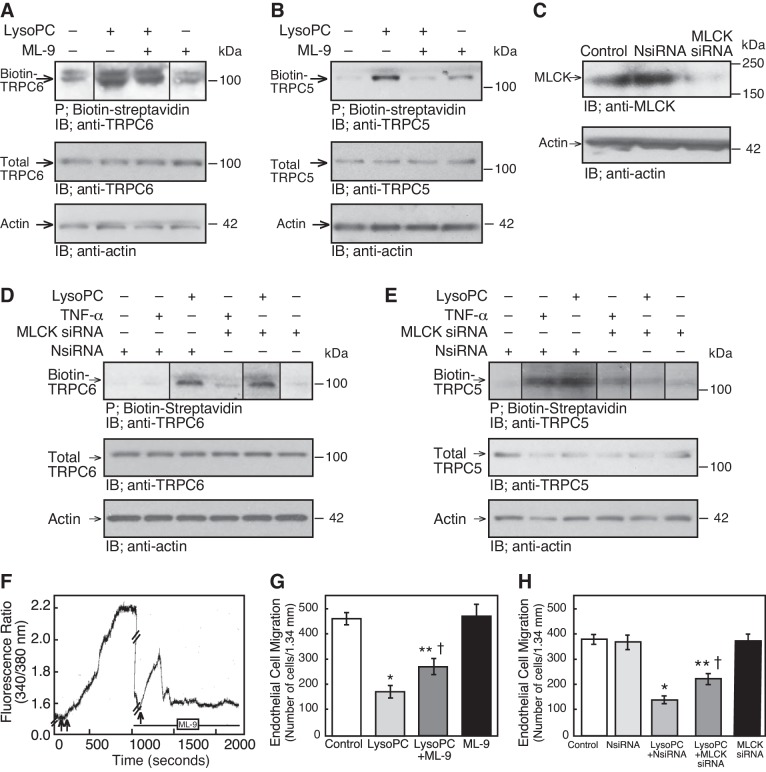
Fig. 8.
MLCK inhibition blocks lysoPC-induced TRPC5 externalization and increased [Ca2+]i, and partially preserves EC migration in lysoPC. A and B: ECs were pretreated with ML-9 (10 µM) for 30 min before incubation with lysoPC (12.5 µM). Externalization of TRPC6 or TRPC5 was detected by biotinylation assay and total TRPC6 or TRPC5 by immunoblot analysis. Actin served as loading control (n = 4). C: ECs were transiently transfected with NsiRNA or MLCK siRNA (30 nM) for 24 h. The siRNA was removed, and 24 h later the cells were lysed. MLCK was detected by immunoblot analysis. Actin served as loading control (n = 4). D and E: ECs were transiently transfected with NsiRNA or MLCK siRNA for 24 h before incubation with lysoPC or TNF-α. Externalization of TRPC6 or TRPC5 was detected by biotinylation assay and total TRPC6 or TRPC5 by immunoblot analysis. Actin served as loading control (n = 4). F: ECs were made quiescent for 18 h, then loaded with fura 2-AM. After the baseline [Ca2+]i was established, lysoPC (12.5 µM) was added to the cells (double arrow) and relative change of [Ca2+]i was measured. After [Ca2+]i plateaued, lysoPC was removed by washing with KR buffer. After readings returned to baseline (in 7–10 min), ML-9 (10 µM) was added and recordings made for 60 s. After 20 min, lysoPC (12.5 µM, arrow) was added, and the relative change of [Ca2+]i was measured. The tracing is representative of four separate experiments (//denotes the wash period and ML-9 incubation period during which times no data were collected). G: ECs were pretreated with ML-9 (10 µM) for 30 min, then the ML-9 was removed, and the migration assay initiated. Migration was assessed after 24 h in the presence or absence of lysoPC. Results are represented as means ± SD (n = 5; *P < 0.001, compared with control; **P < 0.001, compared with ML-9 control; †P < 0.001, compared with lysoPC). H: ECs were transiently transfected for 24 h with NsiRNA or MLCK siRNA (30 nM) and then made quiescent for 12 h. The migration assay initiated, and migration in the presence or absence of lysoPC was assessed after 24 h. Results were represented as means ± SD (n = 5; *P < 0.001, compared with control; **P < 0.001, compared with MLCK siRNA; †P < 0.001, compared with lysoPC with NsiRNA). (In A, D and E, lines indicate lanes rearranged from the same gel. All bands are from the same gel.)

