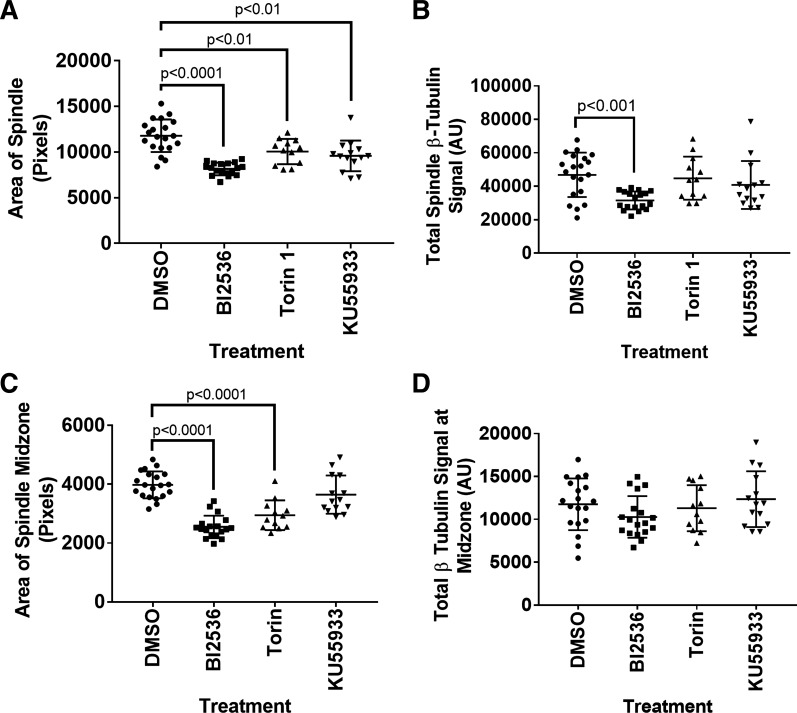
Fig. 6.
Total β-tubulin decreased on MII spindle after 3-h BI2536 treatment. Quantitative analysis of MII spindle characteristics after DMSO, BI2536, Torin 1, or KU55933 treatment. A: quantification of total MII spindle area. B: total MII spindle β-tubulin signal. C: quantification of MII spindle midzone area. D: total MII spindle midzone β-tubulin signal. P values listed in each graph were determined using a Mann-Whitney nonparametric test. Error bars = SD (DMSO, n = 20; BI2536, n = 18; Torin 1, n = 12; KU55933, n = 14).

