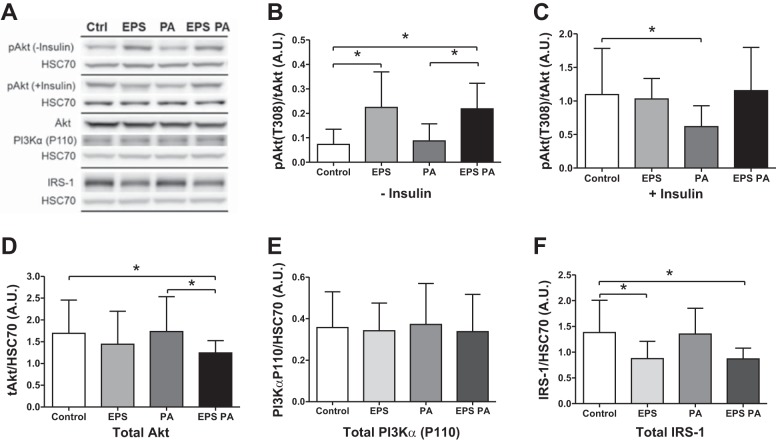
Fig. 4.
Protein expression and phosphorylation for Akt (n = 11), phosphoinositide 3-kinase-α (PI3Kα; n = 9), and IRS-1 (n = 9). A: representative Western blots. B–D: non-insulin (B) and insulin-stimulated (C) phosphorylated Akt (Thr308) expression corrected to total Akt protein (D; both corrected to HSC 70 expression). E and F: total expression of PI3Kα (E) and IRS-1 (F). *P < 0.05.

