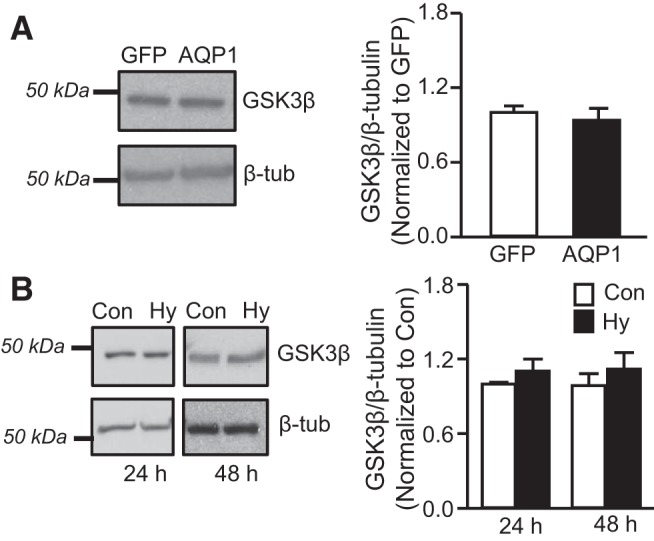
Fig. 9.

Effect of AQP1 and hypoxia on GSK3β expression. A: representative immunoblot showing GSK3β protein levels in PASMCs infected with AdGFP or AdAQP1. Bar graph shows mean ± SE values for the ratio of GSK3β to β-tubulin levels, expressed as fold change from GFP. n = 5 per group. B: Bar graphs show means ± SE values for the ratio of GSK3β to β-tubulin protein in PASMCs maintained under control (Con) or hypoxic (Hy; 4% O2) conditions for 24 or 48 h. Data are expressed as fold change from Con; n = 5 per group.
