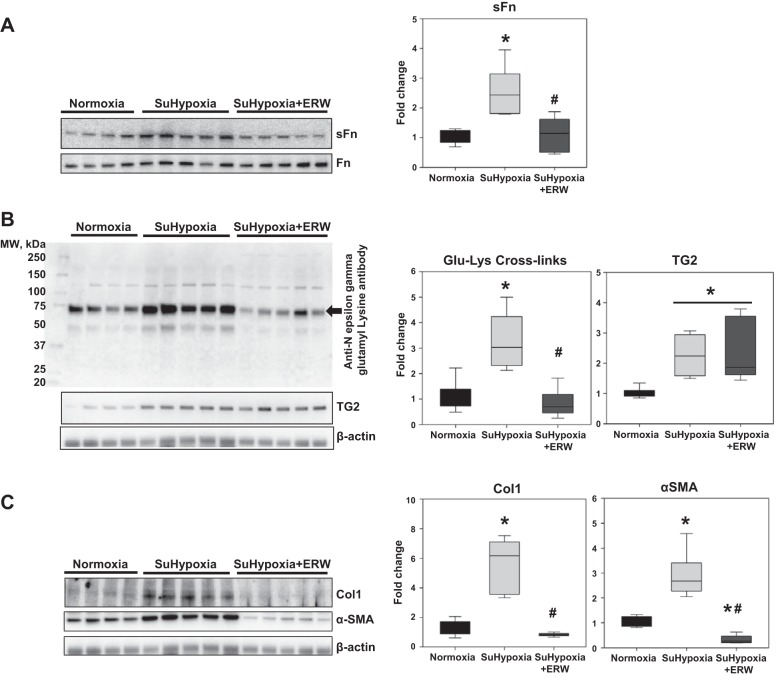
Fig. 3.
Pharmacological inhibition of TG2 activity blocks SuHypoxia-induced serotonylation of fibronectin, TG2 cross-linking activity, and protein expression of Col1 and α-SMA in mouse RV tissue. Representative Western blot analysis of RV protein extracts from mice exposed to normoxia (21% O2), SuHypoxia (10.5% O2), and SuHypoxia+ERW1041E (ERW) showing serotonylation of fibronectin (sFn; 220 kDa) and total fibronectin (Fn; 220 kDa) levels (A); transglutaminase 2 (TG2) reaction product [60 kDa; Nε-(γ-glutamyl)-lysine isopeptide bonds; Glu-Lys cross-links; denoted by arrow], TG2 (78 kDa) and β-actin (45 kDa) levels (B); and type 1 collagen (Col1; 130 kDa), α-smooth muscle actin (α-SMA; 42 kDa), and β-actin levels (C). Each lane corresponds to protein extracts from an individual mouse. Box plots demonstrate fold change in protein expression normalized to total Fn or β-actin assessed by densitometry analysis. Data are presented as 25th to 75th percentiles (boxes), medians (lines), and 5th and 95th percentiles (whiskers). Statistical analysis was performed by one-way ANOVA (Tukey post hoc test). P < 0.05 was considered statistically significant; n = 6/group. *Significantly different compared with vehicle+normoxia control. #Significantly different compared with vehicle+SuHypoxia.

