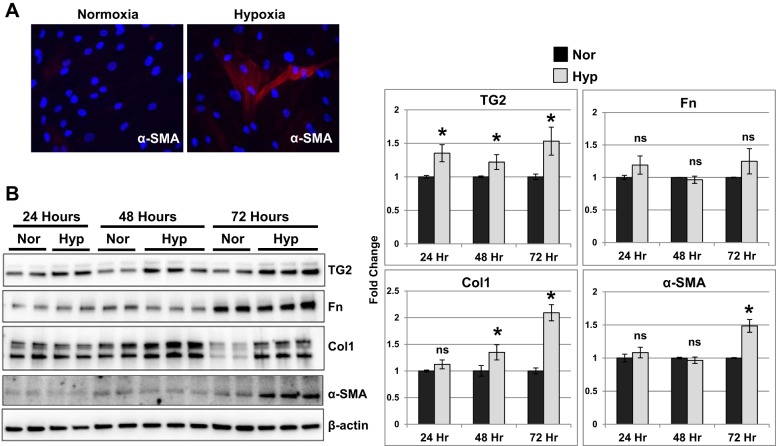
Fig. 4.
Hypoxia exposure stimulated TG2, Col1, and myofibroblast transdifferentiation marker, α-SMA, expression in human RV cardiac fibroblasts. A: representative immunostained images for α-smooth muscle actin (α-SMA; red) and nucleus [4′,6-diamidino-2-phenylindole (DAPI); blue] in RV cardiac fibroblasts exposed to normoxia (21% O2) and hypoxia (3% O2) for 24 h. B: Western blots of protein extracts from RV cardiac fibroblasts exposed to normoxia (Nor) and hypoxia (Hyp) for 24, 48, and 72 h showing transglutaminase 2 (TG2; 78 kDa), fibronectin (Fn; 220 kDa), type 1 collagen (Col1; 147 kDa), α-smooth muscle actin (α-SMA; 42 kDa), and β-actin (45 kDa) levels. Representative blots of three independent experiments performed in duplicates/triplicates. Bar graphs demonstrate fold change in protein expression assessed by normalizing to β-actin levels at each time point by densitometry analysis. Data are presented as means ± SD. Statistical analysis was performed by t-test. P < 0.05 was considered statistically significant; ns, not significant; n = 6–9/group. *Significantly different compared with normoxia control.

