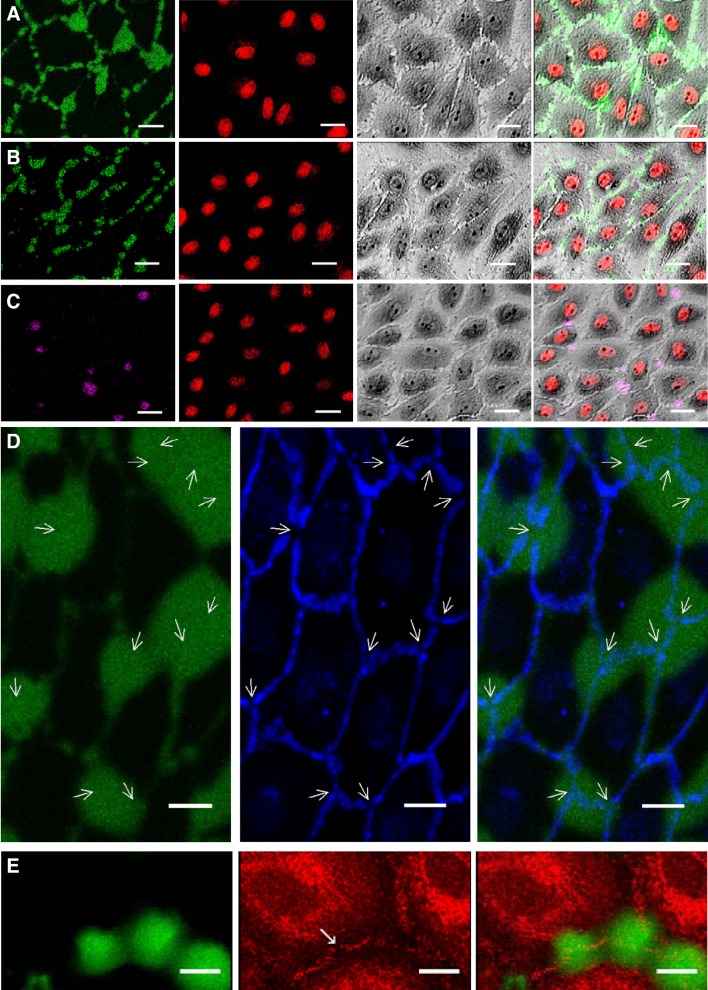
Fig. 2.
Confocal images from in vitro transport experiments showing 66- to 69-kDa FITC-avidin (green; A), 60-kDa FITC-NeutrAvidin (green; B), or 310-kDa R-phycoerythrin-NeutrAvidin (purple; C) together with DRAQ5-stained nuclei (red) and a grayscale phase-contrast image. Overlaying the images in each subpanel demonstrated tracer localization under bicellular and tricellular junctions. Bar = 20 µm. D: confocal images showing FITC-avidin (green) and vascular-endothelial (VE)-cadherin immunostaining (blue). The overlay shows that spots of high tracer uptake colocalized with breaks in the pericellular VE-cadherin staining (arrows). Bar = 10 µm. E: confocal images showing FITC-avidin (green) and zonula occludens-1 immunostaining (red). The overlay shows a spot of high tracer uptake colocalized with a break in the pericellular zonula occuldens-1 staining (indicated with an arrow in the red channel). Bar = 10 μm. n = 3 isolations.

