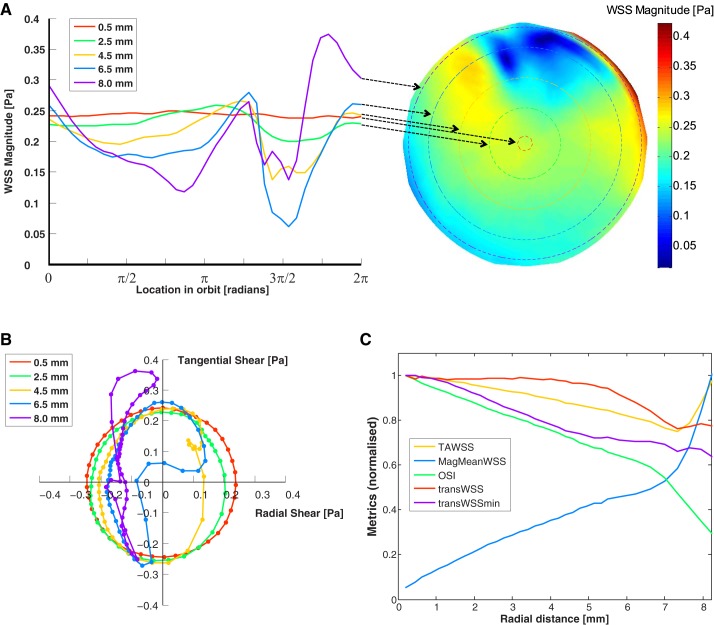
Fig. 5.
A, right: map of the instantaneous wall shear stress (WSS) magnitude acting on the base of the well. The radius of the map has been truncated so that only the area of the well covered by the scanning plate reader is shown. Left: WSS magnitude for different radii throughout one cycle (2π rad). The arrows indicate the radial position for each curve. B: polar plot of the magnitude and direction of instantaneous WSS vectors during one cycle, with different colors representing different radii. Each point of the curve represents the tip of the WSS vector at a single instant. The symbols are spaced at 10-ms intervals. A uniformly rotating vector would appear as a circle centered on the origin. A vector that oscillated between forward and backward uniaxial flow would appear as a line passing through the origin. C: WSS metrics (defined in text) as a function of distance from the center of the well. Each metric has been normalized by its maximum value: time-average WSS (TAWSS), 0.24 Pa; magnitude of the mean WSS (MagMeanWSS), 0.17 Pa; oscillatory shear index (OSI), 0.48; time average of WSS components perpendicular to the mean direction (transWSS), 0.16 Pa; and minimum transverse WSS (transWSSmin), 0.15 Pa. Small ripples in the lines are artifacts caused by the finite size of mesh elements.

