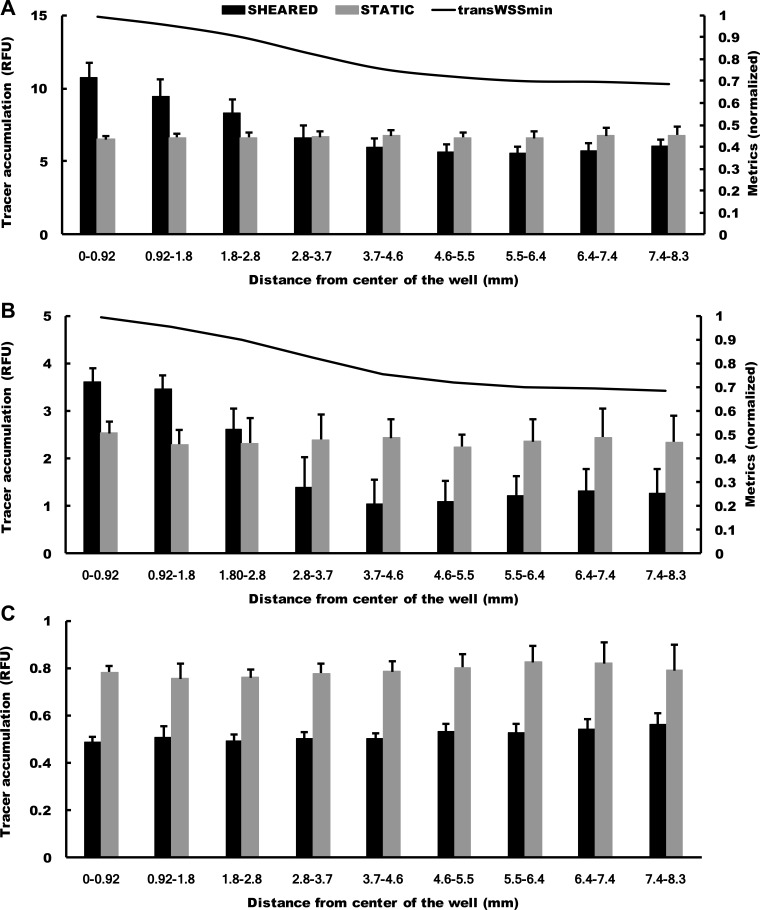
Fig. 7.
Histogram showing means + SD of tracer accumulation under cultured monolayers, with and without shear, at different radial distances from the center of a well for 60-kDa FITC-NeutrAvidin (A), 310-kDa R-phycoerythrin-NeutrAvidin (B), and ~20-nm Qdot 800-streptavidin (C). n = 6 isolations for FITC-NeutrAvidin and R-phycoerythrin-NeutrAvidin and n = 3 isolations for Qdot 800-streptavidin. In A and B, a plot of minimum transverse WSS (transWSSmin) has also been included (see discussion).

