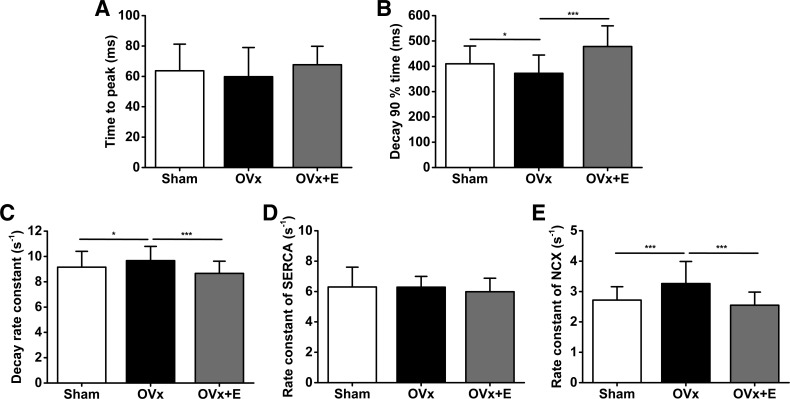
Fig. 3.
Ca2+ transient parameters. Mean time to peak differences are shown in A and time to 90% decay variation is shown in B for sham-operated (Sham), ovariectomized (OVx), and OVx + 17β-estradiol (OVx + E) groups. C shows mean differences in decay rate constants for the transients and D and E show variations in rate constants for SERCA and the Na+/Ca2+ exchanger (NCX), respectively. Sham: n = 56/3, OVx: n = 38/3, and OVx + E: n = 33/3. *P < 0.05; **P < 0.01; ***P < 0.001.

