Fig. 6.
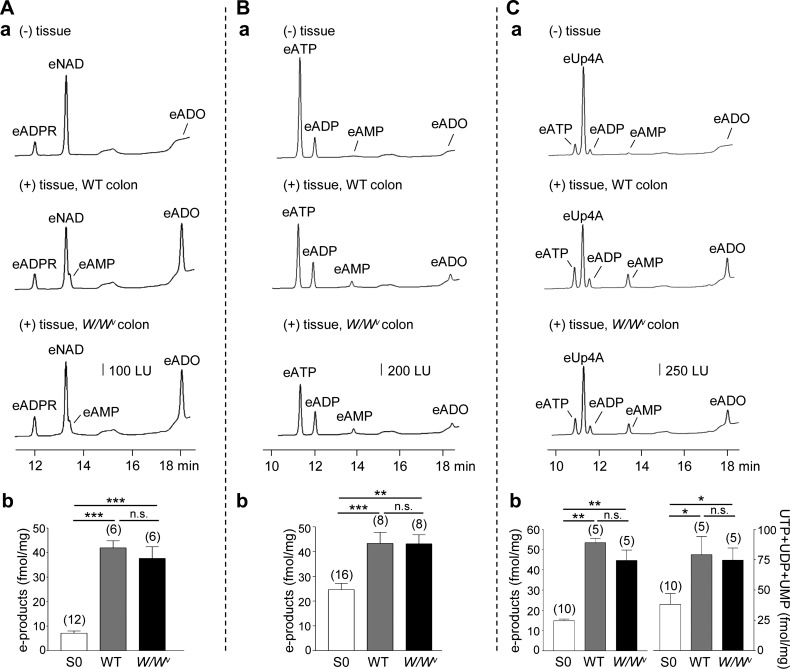
Degradation of eNAD, eATP, and eUp4A in wild-type (WT) and W/Wv colons. A–C, a: chromatograms of eNAD 200 nM (A, a), eATP 50 nM (B, a), and eUp4A 50 nM (C, a) in the absence of tissue [S0, (−) tissue; traces at top] and after superfusion of colonic tissues from WT mice (traces in middle) or W/Wv mice (traces at bottom) with eNAD, eATP, or eUp4A or for 30 s. Superfusion of colons from WT or W/Wv mice resulted in decreased amounts of e-substrates and increased amounts of e-products. LU, luminescence units. A, b: graphical representation of e-product (eADPR+eAMP+eADO) formation from 200 nM eNAD in (−) tissue control (S0), in WT colons, and in W/Wv colons. B, b: graphical representation of e-product (eADP+eAMP+eADO) formation from 50 nM eATP in (−) tissue control (S0), in WT colons, and in W/Wv colons. C, b: graphical representation of e-product (eATP+eADP+eAMP+eADO) formation and UTP+UDP+UMP formation from 50 nM eUp4A in (−) tissue control (S0), in WT colons, and in W/Wv colons. There was no difference in the amounts of products formed from eNAD, eATP, or eUp4A in WT and W/Wv colons (not significant). Significant differences from S0 (*P < 0.05, ***P < 0.01, ***P < 0.001, Student’s t-test); n.s., not significant, P > 0.05. Number of experiments is in parentheses.

