Fig. 2.
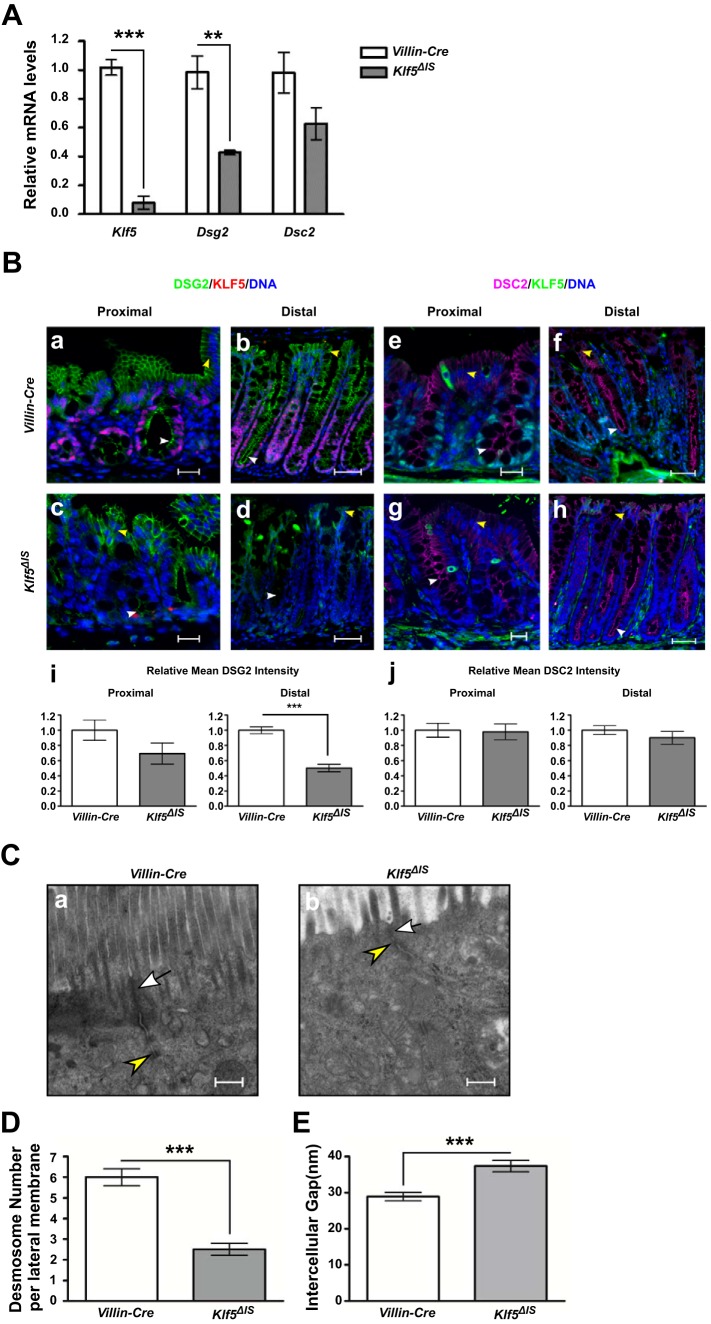
DSG2 is reduced and mislocalized and morphology of desmosomes is altered in the colonic tissue of Klf5ΔIS mice. A: qPCR analysis of Klf5, Dsg2, and Dsc2 mRNA expression levels was performed on tissues from in Villin-Cre mice and Klf5ΔIS mice. Data represent means ± SE (n = 6 for control, and n = 5 for Klf5ΔIS), **P < 0.01 and ***P < 0.001 by Student’s t-test. B: immunofluorescence staining of KLF5 (magenta) and DSG2 (green) (a–d) and KLF5 (green) and DSC2 (magenta) (e–h) in proximal colon and distal colon of control and Klf5ΔIS mice. DNA was counterstained with Hoechst dye. Images were taken at ×200 magnification. Scale bars in proximal sections indicate 20 µm, whereas scale bars in distal sections indicate 50 µm. Yellow arrowheads indicate DSG2 or DSC2 staining on basolateral membranes on the epithelial surface, whereas white arrowheads indicate DSG2 or DSC2 staining on the apical sides of the basolateral membranes in crypts. Relative mean fluorescence intensity was quantified (i and j). Data represent means ± SE (n = 10), ***P < 0.001 by Student’s t-test. C: transmission electron microscopy images showing changes in morphology of desmosomes in Klf5-depleted colonic tissue (a, ×30,000 magnification) compared with the control (b, ×30,000 magnification). White arrows indicate apical junctional complexes; yellow arrowheads indicate desmosomes. Scale bars indicate 400 nm. D: quantitative analysis of the number of desmosomes in colonic cells of Villin-Cre and Klf5ΔIS mice. Data represent means ± SE (n = 4), ***P < 0.001, Student’s t-test. E: quantitative analysis of the width of the intercellular spaces between desmosomes in colonic cells of Villin-Cre and Klf5ΔIS mice. Data represent means ± SE (n = 8), ***P < 0.001, Student’s t-test.

