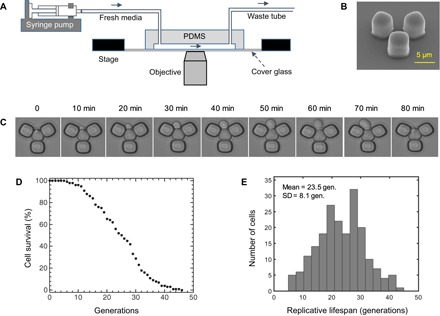
Fig. 1. Experimental measurement of single-cell lifespan and generation durations.

(A) Schematics of the experimental setup with the microfluidic chip and a stage-automated inverted microscope. (B) Scanning electron microscope picture of the functional unit of the microfluidic chip. Scale bar, 5 μm. (C) Time-dynamic bright-field images of a sample mother cell giving birth to a daughter cell. (D) Cell survival as a function of the number of generations (gen.) of the wild-type yeast cells. Cell survival was quantified by taking the fraction of initial cells (n = 200) that were still alive at a specific generation. (E) RLS distribution from 200 wild-type mother cells analyzed. The average RLS is 23.5 generations. PDMS, polydimethylsiloxane.
