
Fig. 3. Performance comparisons among the empirical models.
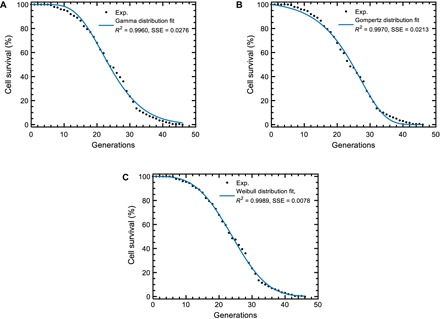
(A to C) Least-squares fit results for the three empirical survival distributions. Experimental wild-type cell survival curve (black dots) was fitted to two-parameter gamma (A), Gompertz (B), or Weibull (C) distributions. The blue line was generated using the best-fitting parameter values extracted from each fit. Higher R2 and lower sum of squared errors (SSE) values show the superior performance of the Weibull distribution. n = 200 wild-type cells formed the experimental survival curve.