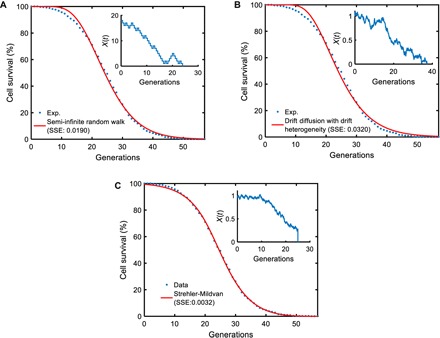
Fig. 4. Performance comparisons among the mechanistic models.

For each microscopic process, n = 200,000 parameter sets were sampled from the parameter ranges (table S9) and fed into the analytical survival functions (see the Supplementary Materials) corresponding to each microscopic model. For each parameter set, the SSE between the simulated survival curve and the experimental survival curve (obtained from the tracking of 1000 wild-type cells) was computed. The parameter sets corresponding to the smallest SSE values for the different models were then used as initial values for the final optimization process using MATLAB’s fminsearch function. The red curve in each panel was generated by using the optimized/fitted parameter values in each analytical survival function. The experimental survival curve is denoted by the blue dots in each panel. The insets show schematic trajectories reflecting the nature of each microscopic process. (A) Semi-infinite random walk (SSE = 0.0190). (B) Drift diffusion with drift heterogeneity (SSE = 0.0320). (C) Strehler-Mildvan model with viability drift diffusion (SSE = 0.0032).
