
Fig. 5. Analysis of single-cell generation times during aging.
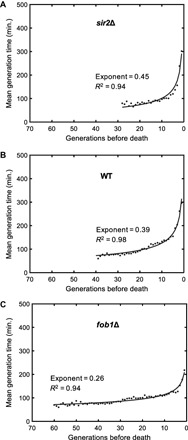
Mean generation times as a function of generations toward the death event for sir2Δ (A), wild-type (WT) (B), and fob1Δ (C) strains. For each generation, single-cell generation durations of all cells experiencing that generation were averaged. The generation times of 121 wild-type, 122 sir2Δ, and 122 fob1Δ cells were analyzed. Solid lines depict the results from fitting the mean generation time data of each strain to a power law function. Fit statistics are provided on the panels.