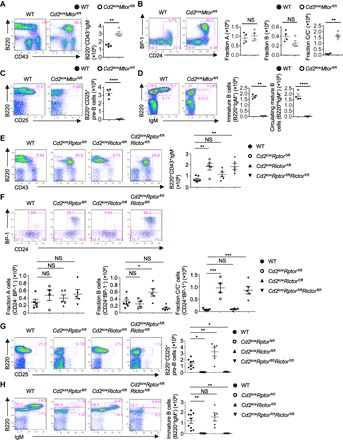
Fig. 2. mTORC1, but not mTORC2, is required for pro-B cell development and pro-B to pre-B cell transition.

(A to D) Representative flow cytometry plots of BM cells from wild-type (WT) and Cd2icreMtorfl/fl mice. (A) Expression of B220 and CD43 on BM lymphocytes, with the percentages of B220+CD43+IgM− cells indicated (after further gating IgM+ cells out of B220+CD43+ cells; see fig. S1A for gating scheme). Right: Number of designated populations. (B) Expression of BP-1 and CD24 on B220+CD43+IgM− cells, with the percentages of fraction A (CD24−BP-1−), fraction B (CD24+BP-1−), and fraction C/C′ (CD24+BP-1+) cells indicated. Right: Number of indicated subset cells. (C) Expression of B220 and CD25 on BM lymphocytes, with the percentage of B220+CD25+ pre-B cells indicated. Right: Number of B220+CD25+ pre-B cells. (D) Expression of B220 and IgM on BM lymphocytes, with the percentages of pro-B/pre-B cells (B220+IgM−), immature B cells (B220+IgM+), and circulating mature B cells (B220hiIgM+) indicated. Right: Number of immature and mature B cells. (E to H) Representative flow cytometry plots of BM cells of WT, Cd2icreRptorfl/fl, Cd2icreRictorfl/fl, and Cd2icreRptorfl/flRictorfl/fl mice and the number of indicated populations. (E) Expression of B220 and CD43 on BM lymphocytes, with the percentage of B220+CD43+IgM− cells indicated. (F) Hardy classification of pro-B cell subsets in the B220+CD43+IgM− gate [from (E)], with the percentages of fraction A (CD24−BP-1−), fraction B (CD24+BP-1−), and fraction C/C′ (CD24+BP-1+) cells indicated. (G) Expression of B220 and CD25 on BM lymphocytes, with the percentage of B220+CD25+ pre-B cells indicated. (H) Expression of B220 and IgM on BM lymphocytes, with the percentages of pro-B/pre-B cells (B220+IgM−), immature B cells (B220+IgM+; statistics are on the right), and circulating mature B cells (B220hiIgM+) indicated. NS, not significant. *P < 0.05, **P < 0.01, ***P < 0.001, ****P < 0.0001 (one-way ANOVA with Tukey’s test). Results represent at least four independent experiments. Data are means ± SEM. Numbers indicate percentage of cells in gates. See also fig. S2.
