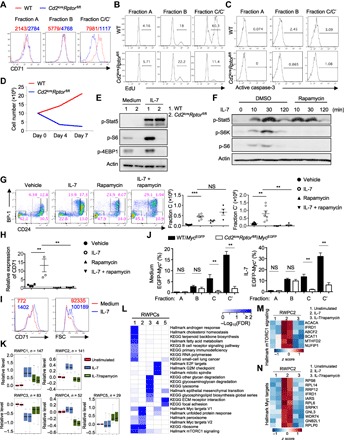
Fig. 3. Raptor-mTORC1 is essential to mediate IL-7 signaling and Myc induction but not Stat5 activation.

(A) Expression of CD71 on fraction A, B, and C/C′ cells from WT and Cd2icreRptorfl/fl mice. Numbers indicate the MFI of CD71 from a representative experiment. (B and C) EdU incorporation (at 1 hour after intravenous injection of EdU) (B) and active caspase-3 staining (C) in fraction A, B, and C/C′ cells from WT and Cd2icreRptorfl/fl mice, with the percentages of EdU+ and active caspase-3+ cells indicated from a representative experiment plotted in the graphs. (D) Cellularity of BM cells after IL-7 stimulation in vitro. Total BM cells were cultured in the presence of IL-7 (5 ng/ml) for 1 week, and cell numbers were counted on days 0, 4, and 7. (E) Immunoblot analysis of p-Stat5, p-S6, and p-4EBP1 in freshly sorted pro-B cells with or without IL-7 stimulation. (F) Immunoblot analysis of p-Stat5, p-S6K, and p-S6 in the in vitro cultured B cells. Lin− BM cells were cultured with OP9 stromal cells with IL-7 for 5 days, and cells were washed and rested overnight before they were restimulated with IL-7 for the indicated time points in the presence or absence of rapamycin. DMSO, dimethyl sulfoxide. (G) Expression of BP-1 and CD24 on BM Lin−B220+CD43+IgM− cells from mice injected with vehicle control, recombinant IL-7 (250 μg/kg), rapamycin (15 mg/kg), or IL-7 plus rapamycin, with the percentages of fraction A, B, C, and C′ cells indicated. Right: Number of fraction C and C′ cells. (H) Relative CD71 expression on fraction C cells from mice treated in (G). The MFI of CD71 from mice treated with vehicle control was set as 1. (I) Human BM pro-B cells (CD3−CD19+CD10+CD34+CD127+) were sorted from healthy donors. Cells were stimulated with recombinant human IL-7 (10 ng/ml) for 24 hours. Expression of CD71 (left) and cell size [measured by forward light scatter (FSC); right] were analyzed by flow cytometry. Numbers in plots indicate the MFI. (J) Frequency of EGFP-Myc+ cells in fraction A, B, C, and C′ cells from WT/MycEGFP and Cd2icreRptorfl/fl/MycEGFP mice cultured for 4 hours in medium (left) or with IL-7 (right). (K) Five RWPCs during pro-B cell activation were defined by WGCNA. The central rectangle represents the first to third quartile, with notch in the plot corresponding to the median expression of all proteins in the sample. End of the whiskers represents minimum and maximum level of expression of the proteins in the cluster. (L) Functional annotations of RWPCs by Hallmark and KEGG databases (FDR < 0.1). (M and N) Rapamycin-dependent IL-7–induced temporal expression of proteins in mTORC1 signaling (M) and Myc targets (N). **P < 0.01, ***P < 0.001 [Mann-Whitney test (J) and one-way ANOVA with Tukey’s test (G and H)]. Results represent three (A to C, E, and F) or two (D, G, and I) independent experiments or are pooled from four (J) or two (G and H) independent experiments. Data are means ± SEM. Numbers indicate percentage of cells in gates. See also figs. S3 to S5 and data S3.
