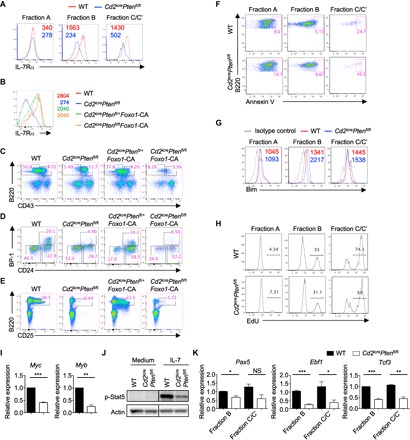
Fig. 6. PTEN promotes early B cell development through Foxo1-dependent and Foxo1-independent mechanisms.

(A) Expression of IL-7Rα on fraction A, B, and C/C′ cells of WT and Cd2icrePtenfl/fl mice. Numbers indicate the MFI. (B to E) Representative flow cytometry plots of BM cells from WT, Cd2icrePtenfl/fl, Cd2icrePtenfl/+Foxo1-CA, and Cd2icrePtenfl/flFoxo1-CA mice. (B) Expression of IL-7Rα in pro-B cells. Numbers indicate the MFI. (C) Expression of B220 and CD43 on BM lymphocytes, with the percentage of B220+CD43+ and B220+CD43− cells indicated. (D) Hardy classification of pro-B cell subsets in the B220+CD43+IgM− gate (from C), with the percentages of fraction A (CD24−BP-1−), fraction B (CD24+BP-1−), and fraction C/C′ (CD24+BP-1+) cells indicated. (E) Expression of B220 and CD25 on BM lymphocytes, with the percentage of B220+CD25+ pre-B cells indicated. (F) Analysis of apoptotic cell death via annexin V staining on fraction A, B, and C/C′ cells. (G) Expression of Bim in fraction A, B, and C/C′ cells of WT and Cd2icrePtenfl/fl mice. Numbers indicate the MFI. (H) EdU incorporation in fraction A, B, and C/C′ cells of WT and Cd2icrePtenfl/fl mice. (I) Reverse transcription polymerase chain reaction (RT-PCR) analysis of Myc and Myb expression in pro-B cells. (J) Immunoblot analysis of p-Stat5 in pro-B cells of WT and Cd2icrePtenfl/fl mice. (K) RT-PCR analysis of Pax5, Ebf1, and Tcf3 expression in fraction B and C/C′ cells of WT and Cd2icrePtenfl/fl mice. *P < 0.05, **P < 0.01, ***P < 0.001 (Mann-Whitney test for cell frequencies and unpaired Student’s t test for cell numbers). Data represent four (A and F), three (J), or two (B to E, G to I, and K) independent experiments. Data are means ± SEM. Numbers indicate percentage of cells in gates. See also fig. S8.
